 Saad Ullah

⬤ Silver futures just delivered something traders almost never see—a genuine 10-sigma statistical shock that ripped through the market at the end of last week. Friday's price action was so extreme that when you measure it against historical volatility patterns, it falls miles outside anything a normal market distribution would predict. The data goes back to the 1970s, and even during silver's wildest runs, moves like this barely show up on the radar.
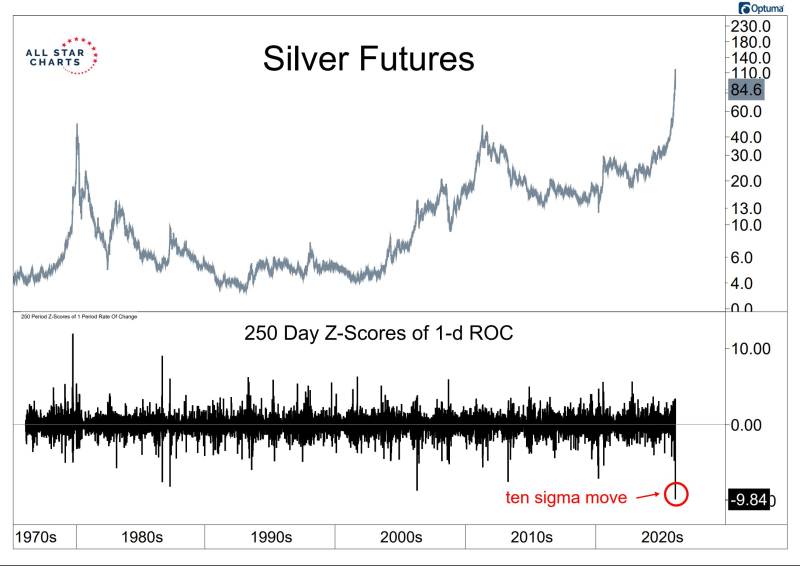
⬤ The breakdown tells the story clearly. Silver had been riding a strong bullish wave before everything flipped. The 250-day Z-score of the one-day rate of change plunged to around minus 9.8—a reading so far into the tail that it stands as one of the most extreme observations in half a century of data. Not even the late-1970s silver mania and subsequent crash produced consistent readings at this level.
⬤ What makes this significant beyond just silver itself is what it says about risk modeling across markets. A 10-sigma event shouldn't happen in a normal distribution—ever, really. But markets aren't normal, and when they break, they break hard. This kind of shock ripples beyond silver: it forces recalibrations in volatility expectations, hits derivatives pricing models, and reminds everyone that traditional risk frameworks can fail spectacularly when markets enter nonlinear territory.
⬤ For commodities traders and anyone watching precious metals, this episode is a reality check. Silver doesn't just trend smoothly—it can gap violently when positioning gets crowded and volatility surges. The statistical rarity of this move puts it in a class with some of the most disruptive market events on record, and it's likely to influence how traders approach risk in silver and related assets going forward.
 Saad Ullah


