 Peter Smith

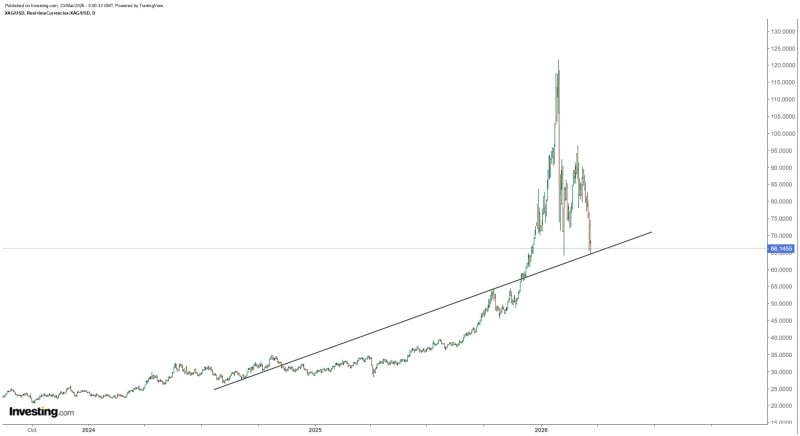
Silver (XAG/USD) is staging a technical rebound after pulling back from its spike above $100, with price now reacting near the $66 level on the daily chart. As analyst Rashad Hajiyev noted, the current move reflects a classic pattern where former resistance near $66 is now acting as support, one of the most widely followed continuation signals in trending markets.
The broader chart structure remains constructive. A long-term ascending trendline that has guided price action since 2024 continues to underpin the rally. After the sharp advance into early 2026, silver pulled back sharply into the breakout zone around the mid-$60 range. This area now represents a confluence of prior resistance and dynamic trendline support, a setup that has defined the bullish sequence throughout this cycle.
$64-$67 Zone Remains the Structural Pivot for XAG/USD
The $64 to $67 range has drawn repeated attention across recent coverage.
Silver's breakout above multi-decade resistance positioned the $50 to $70 band as a long-term accumulation zone, and price is now retesting precisely that area.
The transition of resistance into support is not just a technical rule. It reflects how market participants reprice conviction after a major breakout.
The reaction here will determine whether the broader uptrend resumes or gives way to a deeper corrective phase.
Trendline Support and Sentiment After Extreme Volatility
The current stabilization near $66 follows a period of extreme volatility that briefly pushed silver well above $100. Whether the pullback is corrective or marks a structural reversal depends on how price holds this zone. A trendline break below $64 would signal a 15% downside risk, making this level one of the more consequential technical thresholds across the precious metals market right now. A sustained hold above the breakout zone would keep the bullish case intact and reinforce momentum heading into the next leg of the rally.
 Peter Smith


