 Saad Ullah

Silver (XAG) is making headlines again as it climbs steadily toward the crucial $50 level after smashing through long-standing resistance barriers. The monthly chart paints a compelling picture of sustained bullish momentum, making pullbacks particularly attractive for investors eager to capitalize on the next wave of this precious metal rally.
Silver's Technical Breakout
The monthly chart for silver (XAG/USD) shows a clean break above the pivotal resistance zone around $38–$40, solidifying the breakout pattern. Trader CA Siddharth, who turned bullish on silver back in May 2024, points to the metal's impressive resilience as it continues carving out higher highs and higher lows throughout the past year.
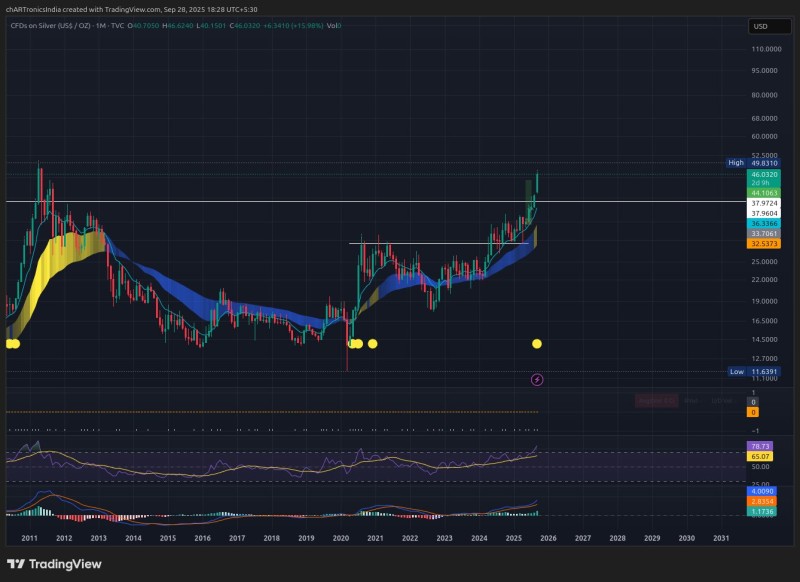
The former resistance zone near $38 has now flipped to become solid support, while silver currently trades around $46, tantalizingly close to testing the next major hurdle at $50. Technical indicators are singing the same tune – both RSI and MACD are pointing higher, reinforcing the bullish narrative.
Why Silver Is Rallying
This isn't just a technical story. Multiple macroeconomic forces are converging to power silver's ascent. Global inflation remains stubbornly persistent, driving investors toward precious metals as reliable stores of value. Meanwhile, silver's industrial applications continue expanding, particularly in solar panels, electric vehicle batteries, and other green technologies that are reshaping our energy landscape. The weakening dollar narrative adds another layer of support, as commodities priced in USD typically benefit when the greenback softens.
Strategic Investment Perspective
The chart structure strongly suggests silver remains locked in a confirmed long-term uptrend. Smart traders are eyeing any pullbacks toward the $40–$42 zone as prime entry points. Should this bullish momentum maintain its current pace, silver could realistically target the $55–$60 range over the medium term – levels we haven't witnessed since the dramatic spike of the 1980s.
 Saad Ullah


