 Usman Salis

⬤ Silver just delivered one of its most explosive runs in recent history, rocketing from around $28 in early April 2025 to above $90 by early 2026. The weekly chart shows how silver locked into a tight range throughout April 2025 before launching into a steep climb. XAG/USD has now more than tripled in less than a year, marking a fundamental shift in the metal's long-term price structure.
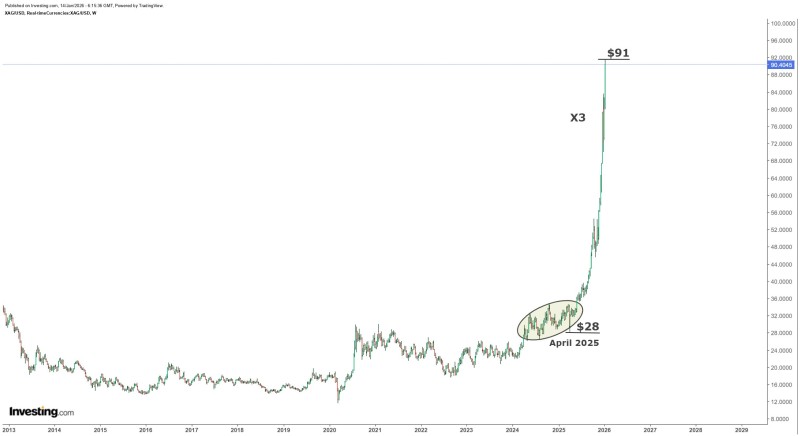
⬤ The chart tells the story of a multi-year setup finally paying off. From 2013 through most of 2024, silver bounced around in a wide but relatively flat range under $30. During that time, price gradually carved out higher lows—classic accumulation behavior. By early 2025, silver compressed into a clearly marked consolidation zone near $28, which turned out to be the launchpad for the explosive move that followed.
⬤ Once silver broke out from that April 2025 base, it didn't look back. The chart shows an almost vertical ascent with barely any meaningful pullbacks. XAG/USD tore through resistance level after resistance level, eventually pushing toward $91. That 3X gain happened with minimal consolidation along the way, suggesting genuine directional conviction rather than choppy volatility.
⬤ This move isn't just about silver—it's a textbook example of how extended compression phases can unleash massive directional trends. Silver's surge to decade highs puts precious metals back in the spotlight and signals shifting long-term dynamics across the sector. With XAG/USD now trading well beyond its historical range, traders are watching closely to see whether the metal consolidates these gains or if the trend still has legs.
 Usman Salis


