 Usman Salis
⬤ Silver prices have staged a remarkable long-term rally, climbing sharply from late 2022 through December 2025. The daily chart shows XAG/USD trading within a rising channel for several years before really taking off in 2025. Silver nearly tripled during this stretch, posting total gains of around 175% from December 2022 to December 2025.
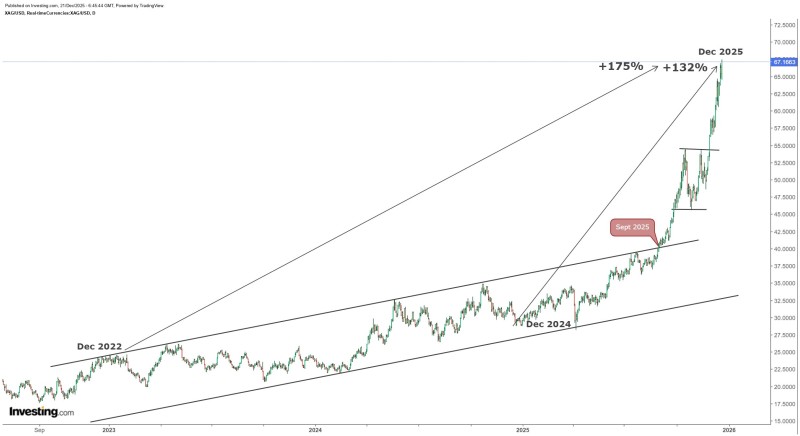
⬤ Most of this move happened recently. The chart data shows silver jumped roughly 132% over just the past 12 months, marking a clear shift in momentum. September 2025 stands out as the pivotal moment when silver broke above the upper edge of its multi-year channel. After that breakout, prices kept pushing higher into year-end.
⬤ From a technical standpoint, the price action shows a shift from steady accumulation into a stronger trending phase. Through 2024 and early 2025, silver stayed within the boundaries of its rising channel, producing controlled rallies and pullbacks. After the September 2025 breakout, the chart shows steeper gains and stronger momentum, with prices reaching the upper 60s by December 2025.
⬤ This evolution matters because silver sits at the intersection of industrial demand, monetary dynamics, and commodity cycles. Sustained strength in silver prices can influence sentiment across precious metals and related sectors. Silver's ability to hold elevated levels after breaking its multi-year channel suggests momentum may continue into 2026, keeping it firmly on traders' radar across global commodity markets.
 Usman Salis


