 Peter Smith

⬤ Silver is testing critical technical levels after a sharp pullback from highs above $100. Price has declined toward the $70 area and is now approaching the 0.618 Fibonacci retracement near $60.8. As Ole S Hansen noted, the recent weakness reflects a broader liquidity shift that has pressured previously strong trades, including Silver Tests $64 Support as Trendline Break Signals 15% Risk, where analysts flagged that losing trend structure could drive price toward the $57 region.
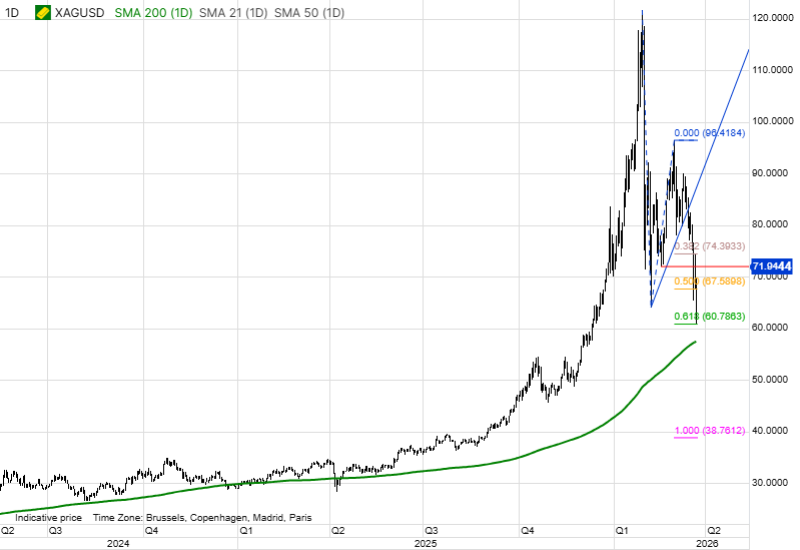
⬤ The chart confirms a rapid correction after an extended rally, with key Fibonacci levels acting as reference points. The 0.382 level near $74 and the 0.5 level near $67.5 have already been tested. The 0.618 level at $60.8 is now the next major support, and downside momentum remains active.
⬤ If the $60.8 level fails, the next key downside reference is the 200-day moving average near $57.6 - a major long-term support zone. Similar setups were outlined in Silver Holds Ascending Broadening Wedge Pattern as $80 Price Volatility Persists, where wide swings following strong rallies were flagged as a recurring pattern in silver's structure.
⬤ The current positioning of XAG/USD marks a transitional phase driven by both technical and macro factors. The reaction at the 0.618 Fibonacci level and the 200-day MA will be critical in determining whether silver stabilizes or extends its correction. As discussed in Silver (XAG) Price Analysis: Break Above $89 Could Target $120 to $150, deep corrective phases often follow sharp advances - and these levels now shape broader sentiment across the precious metals market.
 Peter Smith


