Peter Smith

Silver has entered a defining moment. After a parabolic rally over the past year, the metal now sits just below the critical $50 resistance level. The question now gripping investors is simple: will silver finally break through, or will it face another rejection like in past cycles?
Chart Analysis: Silver's Rally to Multi-Year Highs
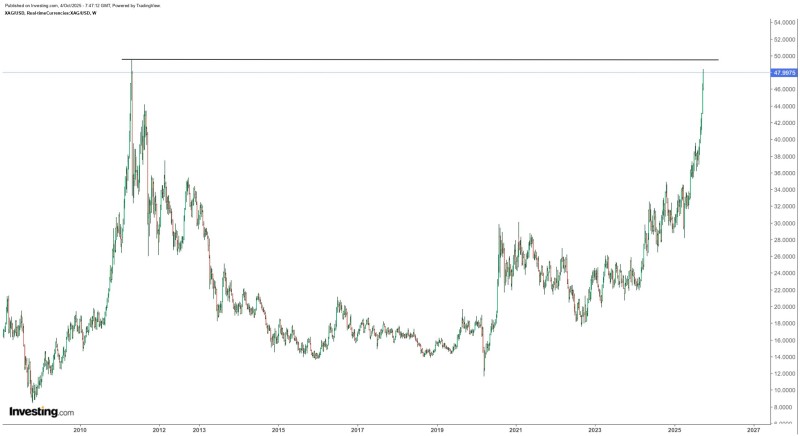
In a recent post, Rashad Hajiyev pointed out that silver is only 3% away from retesting this historic price ceiling. The weekly XAG/USD chart shows the magnitude of this move. Silver has surged from around $25 in early 2024 to nearly $48 today, marking one of its strongest runs in over a decade. The $50 level represents silver's all-time high set back in 2011 and has since acted as both a psychological barrier and technical ceiling. While momentum remains strong, the near-vertical nature of this rally also carries pullback risk if buying pressure can't be sustained above resistance. The chart reflects exactly what traders are seeing: silver is within striking distance of a level that has historically defined major turning points.
Why Silver Is Rallying
Several factors explain silver's explosive climb. Persistent inflation concerns have driven increased demand for precious metals as a hedge. Growing industrial use, particularly in green technologies like solar energy, adds fundamental support. A weaker U.S. dollar has lifted commodity prices across the board, including silver. And with the metal so close to its all-time high, both retail and institutional traders are fueling speculative momentum.
Resistance sits firmly at $50, the critical breakout threshold. If rejected, silver could pull back to $44 or even $40 for support. On the flip side, a breakout above $50 could open the path toward $60–65, levels never reached in modern trading history.
 Peter Smith