Eseandre Mordi

The move, first outlined by The Long Investor, shows a clean reaction from a major Fibonacci extension followed by a rapid pullback consistent with a Wave 4 correction. The sequence reinforces how extended rallies tend to resolve once key levels are hit.
The Exact Silver Rejection That Ended the Rally
Silver's rally accelerated into a vertical move, culminating in a spike to roughly $121 - right into a major Fibonacci resistance zone marked near the 2.618 extension. The reaction was immediate.
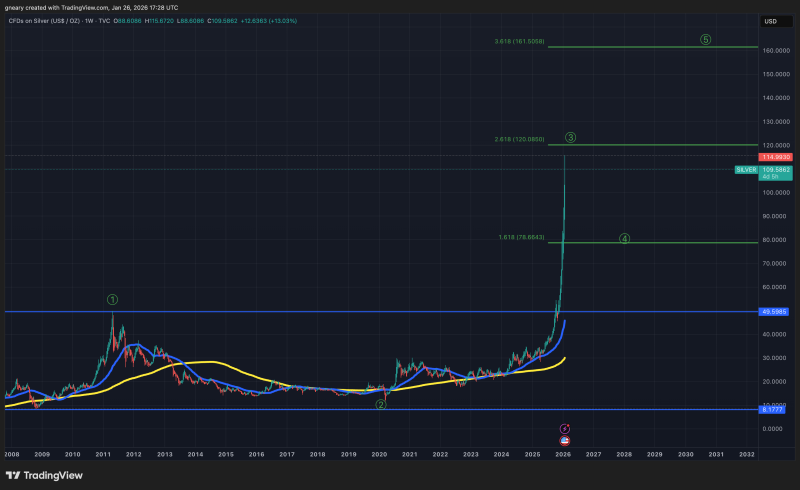
Rather than consolidating near highs, price reversed aggressively - signaling exhaustion at that level. This aligns directly with how parabolic moves into strong resistance typically resolve: quickly and without giving market participants much time to reposition.
A sharp expansion phase followed by an equally sharp rejection - leaving little time for market participants to reposition before the damage was done.
Silver Breakout Targets $96 After Retest Holds captured the momentum building into the upper resistance zone, showing how the breakout structure that carried silver toward $120 looked entirely valid right up until the Fibonacci extension triggered the reversal.
A Textbook Silver Wave Completion and Reset
The structure outlined in the chart suggests a completed impulsive move - Wave 3 - ending at the $120 region, followed by a fast transition into Wave 4. That correction has already driven silver down into the mid-$70s, closely matching the projected retracement zone from the original call.
This type of move is consistent with broader technical behavior, where strong trends are followed by controlled pullbacks rather than immediate continuation. The key is whether the pullback holds structure - if it does, it becomes a staging area before the next leg rather than the beginning of a breakdown.
Wave 3 ended at $120, Wave 4 has driven price into the mid-$70s - whether the pullback holds structure determines if this is a staging area or the beginning of something worse.
Silver Eyes Pullback to $73 Support Before Next Leg Higher outlined the retracement target that is now being tested in real time, making it one of the more precisely anticipated levels currently in play across the precious metals market.
Silver Moves From Euphoria to Potential Opportunity
The key shift now is positioning. At the highs near $120, the chart reflects a clear sell zone reaction where upside momentum peaked into resistance. With price significantly lower, the same structure is being reframed as a potential re-entry zone:
- Resistance triggered distribution near $120
- The pullback into the $70s reflects a reset phase
- Price is returning to a level where demand may begin rebuilding
This transition - from extreme extension to retracement - is central to how cyclical moves develop in trending markets.
Silver's 7-Year Cycle Points to $30 by 2029 Low adds a longer-term perspective that complicates the near-term recovery thesis, raising the question of whether the current Wave 4 correction is a buying opportunity within a bull market or the early stages of a more significant multi-year decline.
 Eseandre Mordi