 Artem Voloskovets
⬤ Silver's price action has shifted into high gear on the weekly timeframe, with XAGUSD breaking cleanly out of an extended consolidation pattern. What we're seeing now is what traders call a third wave move — typically the most explosive phase of any uptrend. The metal has punched through previous resistance and is now accelerating into fresh territory, confirming that a new bullish leg is underway.
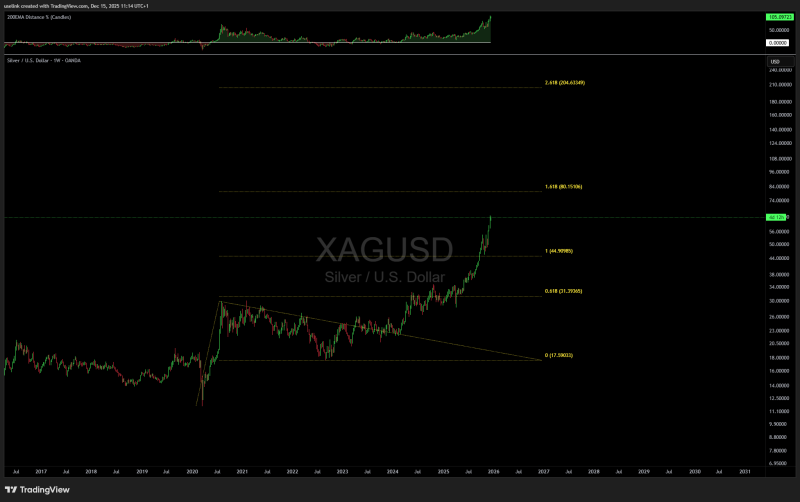
⬤ Looking at the chart's Fibonacci extensions, several key price zones come into focus. The 1.0 extension around the mid-$40s has already been cleared during this rally. The next major level sits at the 1.618 Fibonacci extension near $80 — a zone that often acts as a magnet during third wave advances. This projection comes straight from the broader price structure and gives traders a concrete technical benchmark to watch.
⬤ Beyond the $80 mark, additional Fibonacci projections stretch into the $90-$100 range. These aren't immediate targets but rather long-term reference points that match the scale of this breakout on the weekly chart. Given how third waves tend to exceed basic expectations, these upper zones are worth keeping on the radar as the move develops.
⬤ Why does this matter beyond just silver traders? The metal sits at the intersection of precious metals demand and industrial usage, making it a broader market indicator. When silver shows this kind of sustained strength, it often reflects changing views on inflation, currency stability, and global economic momentum. The emergence of a clear third wave pattern backed by Fibonacci extensions shows how technical structure is driving market attention as silver enters this higher-energy phase.
 Artem Voloskovets


