 Peter Smith

⬤ U.S. natural gas supply is showing clear signs of weakness as production struggles to bounce back after recent disruptions. Pipeline nomination data—which traders watch closely as a real-time indicator—has been sliding for four consecutive days now, suggesting the recovery everyone expected just isn't materializing.
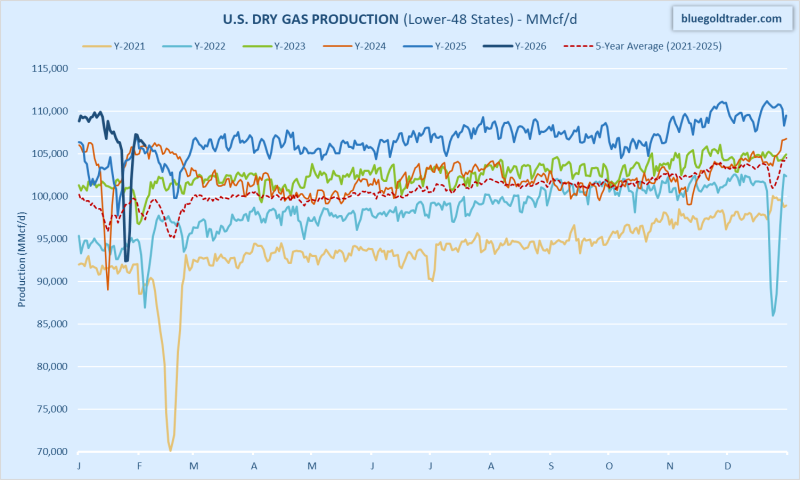
⬤ Right now, U.S. dry natural gas production is running at about 105.9 billion cubic feet per day. That's a solid 4 bcf/d drop from the year-to-date peak we saw on January 12. Looking at the chart comparing this year's output to previous years, production is still historically strong—but it's lost momentum and is now tracking closer to the five-year average instead of pushing new highs.
⬤ What's interesting here is how different this looks compared to past weather-related disruptions. In previous years, production typically snapped back pretty quickly after storm impacts. This time? Not so much. Output has been bouncing around below recent highs without any real follow-through to the upside.
⬤ This matters because short-term production trends directly impact how natural gas trades and where prices go. If output stays sluggish while demand holds steady, we could see tighter conditions develop faster than expected. With pipeline flows continuing to soften and production clearly off its peak, traders will be watching closely to see if this stabilizes or keeps weakening.
 Peter Smith


