 Alex Dudov
⬤ Gold is currently trading in a clear consolidation structure that matches up with earlier phases of the bull market that kicked off in October 2023. Each major consolidation during this run has lasted around three months before prices took off again. The chart shows a consistent pattern: tightening price ranges followed by sharp rallies.
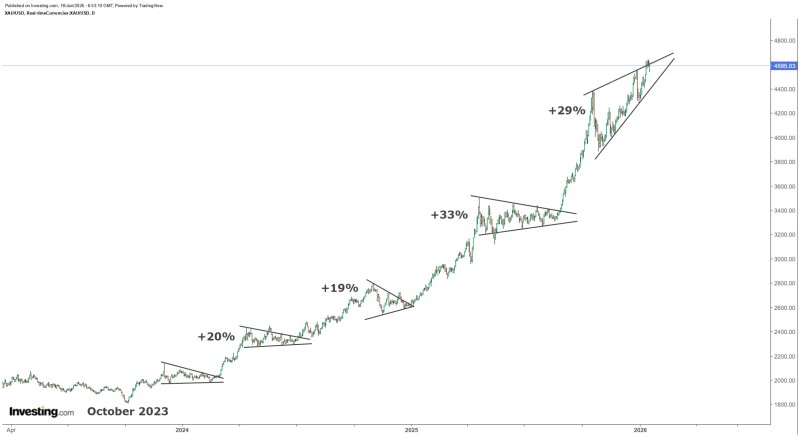
⬤ Since late 2023, gold has delivered some impressive gains after similar consolidation periods—jumps of about 20%, 19%, 33%, and most recently nearly 29%. Every one of these moves came after prices compressed within narrowing channels, then suddenly accelerated upward. The current consolidation, showing up as an ascending wedge on the chart, has now been going on for about as long as previous pauses in this trend.
⬤ Recent advances have beaten the long-term average gain of roughly 25%, with the last two rallies pushing closer to 30%. Gold is now trading near the top of its rising formation, with prices approaching the mid-$4,500 area. This setup looks almost identical to earlier moments when extended consolidations broke out into strong directional moves.
⬤ This pattern matters for the broader market because gold increasingly reflects shifts in economic conditions, monetary policy expectations, and where big money is flowing. The repetition of similar consolidation structures shows the technical consistency of this bull cycle, while the extended trend demonstrates how these orderly pauses help sustain momentum over time.
 Alex Dudov


