Marina Lyubimova

⬤ Gold keeps a stable course as it nears a key barrier between $4,170 and $4,180; it trades inside a wider band that runs from $3,990 to $4,180. At about $4,118, XAU traces a pattern that narrows - a support line tilts upward from below, while a resistance line tilts downward from above. On the daily chart the price draws a triangle - buyers guard the $3,990 floor and sellers guard the ceiling. The space between the two lines shrinks as the metal moves toward a possible breakout.
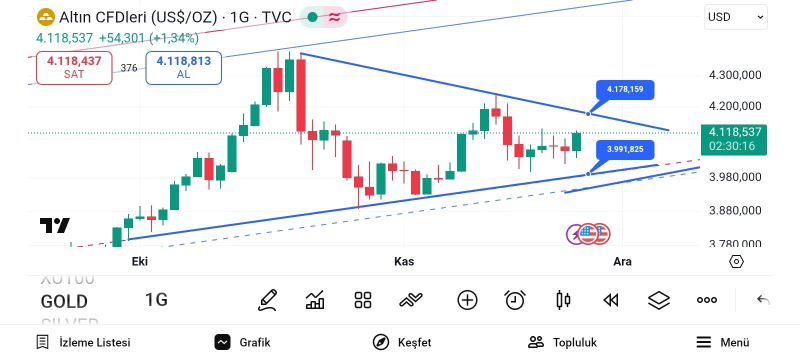
⬤ The chart displays a row of higher lows that stay above $3,990, a sign that buyers stay active even though the range is tight. After earlier tries to reach $4,200, gold now rests near the midpoint of its range. The main reference points are the $4,178 ceiling overhead plus the $3,991 rising line beneath. Recent bars show gentle upward pressure as XAU/USD nears the top of its band.
⬤ Observers remark that “if gold clears the $4,170-$4,180 zone, the next area to watch stretches from $4,240 to $4,300.” The chart backs that view - price compresses under the downward sloping line as if it prepares to challenge the upper zone. Each rebound from the rising support line shows that bids keep arriving - yet a firm push through $4,170-$4,180 could remain hard in the near term.
⬤ The pattern carries weight because gold's short term moves often echo broad risk mood, liquidity and trader positions. A clear close above $4,180 would probably spark fresh upward drive and expose higher targets. If price keeps failing beneath that ceiling, it would reveal caution among traders who wait for a clearer spark. The clash between the rising support but also the falling resistance leaves XAU at a junction that should decide its next sizeable step.
 Marina Lyubimova