 Saad Ullah

⬤ Gold has started pulling back after climbing above the $5,000 mark in what turned out to be an overextended move. The precious metal couldn't hold that psychological level and has been retreating as the momentum faded. The weekly chart shows a clear rejection right after the breakout attempt, marking a shift from the strong upward momentum that dominated earlier.
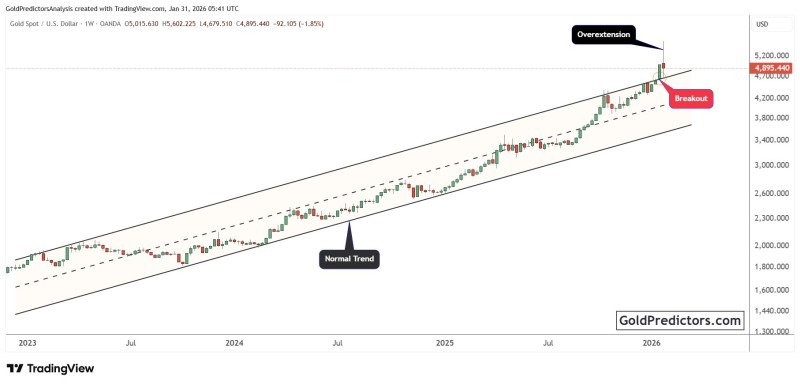
⬤ The chart reveals gold had been climbing within a well-defined ascending channel throughout 2023, 2024, and into 2025—what traders call a normal trend phase where pullbacks stayed neatly within the channel boundaries. But the recent push above the upper trendline broke that pattern. Almost immediately, selling pressure kicked in, confirming the rally had gotten ahead of itself compared to its historical pace.
⬤ That breakout above the channel happened right when the move was flagged as overextended. History shows these kinds of stretched rallies, especially above major round numbers, tend to snap back pretty quickly. The pullback we're seeing now fits that pattern—when gold pushes too far too fast beyond established trend lines, it often triggers an abnormal correction back below the breakout point. While there's no specific downside target marked on the chart, it's clear the price couldn't stick above the channel and has reversed back toward it.
⬤ This reversal matters because it shows how momentum-driven rallies can lose steam quickly once price breaks out of its normal trading pattern. Even in long-term uptrends, failed breakouts can spark sharp corrections and crank up volatility. Right now, gold appears to be shifting from its extended rally into a cooling-off period, with traders watching closely to see if it stabilizes back within the previous trend channel or keeps sliding lower.
 Saad Ullah


