 Usman Salis
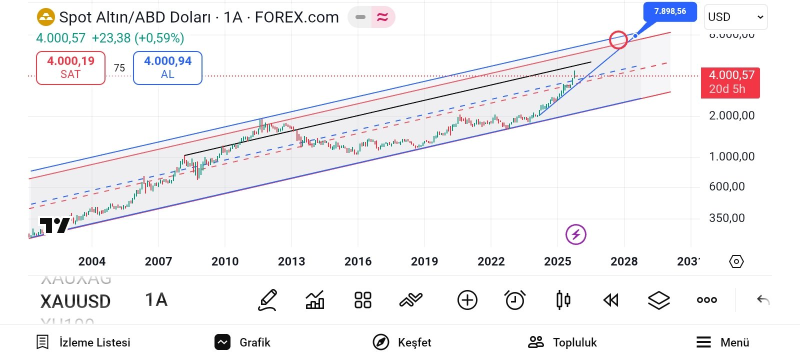
⬤ Long-term gold charts show prices moving within a major rising channel, creating room for significantly higher levels if the current momentum holds. This forecast relies heavily on silver's performance and the gold-to-silver ratio, suggesting that dynamics between these metals could drive gold's next major move upward.
⬤ The analysis points to silver targets of $85–$100 based on simple chart formations. If the gold-to-silver ratio compresses to 65–70 at those levels, the math points to gold reaching $6,500–$7,000 (calculated as 65–70 × $85–$100). The underlying gold chart supports this scenario, showing prices climbing toward the upper boundary of its multi-year channel.
⬤ This is a market projection, not a guaranteed outcome. The scenario requires silver to rally substantially and the gold-to-silver ratio to compress from current levels above 80 down to 65–70. Key risks include silver underperforming, the ratio staying elevated, rising real interest rates, or a strengthening dollar that caps gold's upside.
⬤ If silver strengthens and the gold-to-silver ratio falls as projected, gold could make a powerful move toward $6,500–$7,000. If these conditions don't materialize, gold will likely continue trading within its established channel, delaying but not invalidating the longer-term bullish setup.
 Usman Salis


