 Eseandre Mordi

Gold (XAU) impressive climb is hitting pause as technical indicators point toward a brief correction. After touching a fresh local peak above $4,370, momentum has softened with a clear divergence emerging on the RSI. This development suggests buyers are catching their breath before the next leg higher takes shape.
Technical Pattern Confirms Correction Phase
Matthew Dixon recently highlighted how bearish RSI divergence coincided with the completion of wave 3 in gold's Elliott Wave structure. The chart tells the story clearly — price kept pushing to new highs while RSI made lower highs, a textbook signal that bullish energy was running thin.
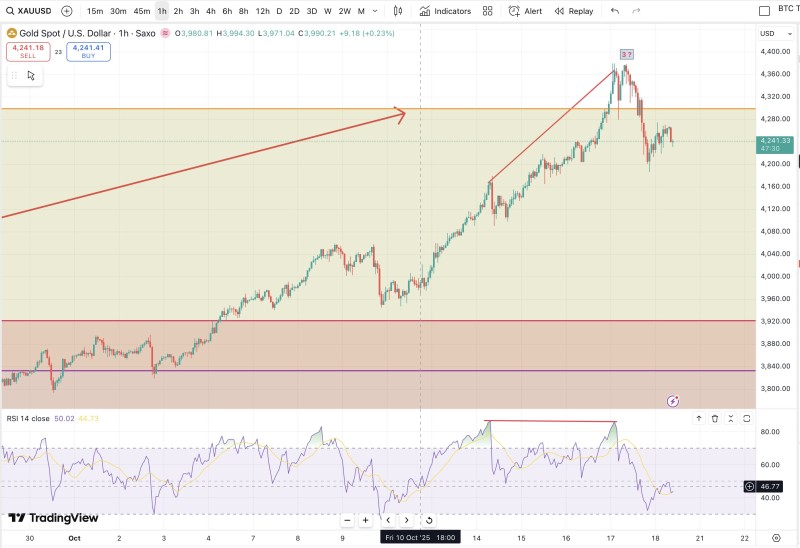
The pullback that followed confirmed this reading, with gold sliding toward $4,240 in what looks like a zigzag correction pattern. The hourly chart reveals that after this divergence materialized, gold retreated from its upper resistance zone but held firm above $3,920, a crucial support level established in early October. RSI has cooled off considerably, dropping from overbought territory near 80 down to roughly 47, showing that short-term pressure has eased and the market is finding balance.
Fundamentals Still Support Higher Prices
The temporary pullback hasn't changed the bigger picture. Ongoing inflation worries, geopolitical tensions, and steady central bank buying continue fueling demand for the metal. Investors are treating gold as essential protection against market turbulence and currency erosion, which keeps sentiment constructive even during these short-term dips. Analysts anticipate the correction playing out somewhere between $4,100 and $4,000, likely wrapping up the Elliott Wave pattern before fresh upside momentum builds. If things develop as expected, the next rally could push beyond $4,400, potentially setting another record high before year-end.
 Eseandre Mordi


