Usman Salis

Gold's remarkable climb keeps drawing attention across financial markets. The metal has pushed up to $4,347.9, adding 2.49% in just one day and extending what's already been an impressive multi-week run. But underneath the excitement, there's growing caution.
Technical Picture: Bulls Hold the Reins
A brief tweet from BuerTrades saying "The big short" has gotten people talking about whether this rally has stretched too far. The current chart shows bullish momentum still holding strong, yet technical readings are hitting extreme levels that often come before short-term pullbacks.
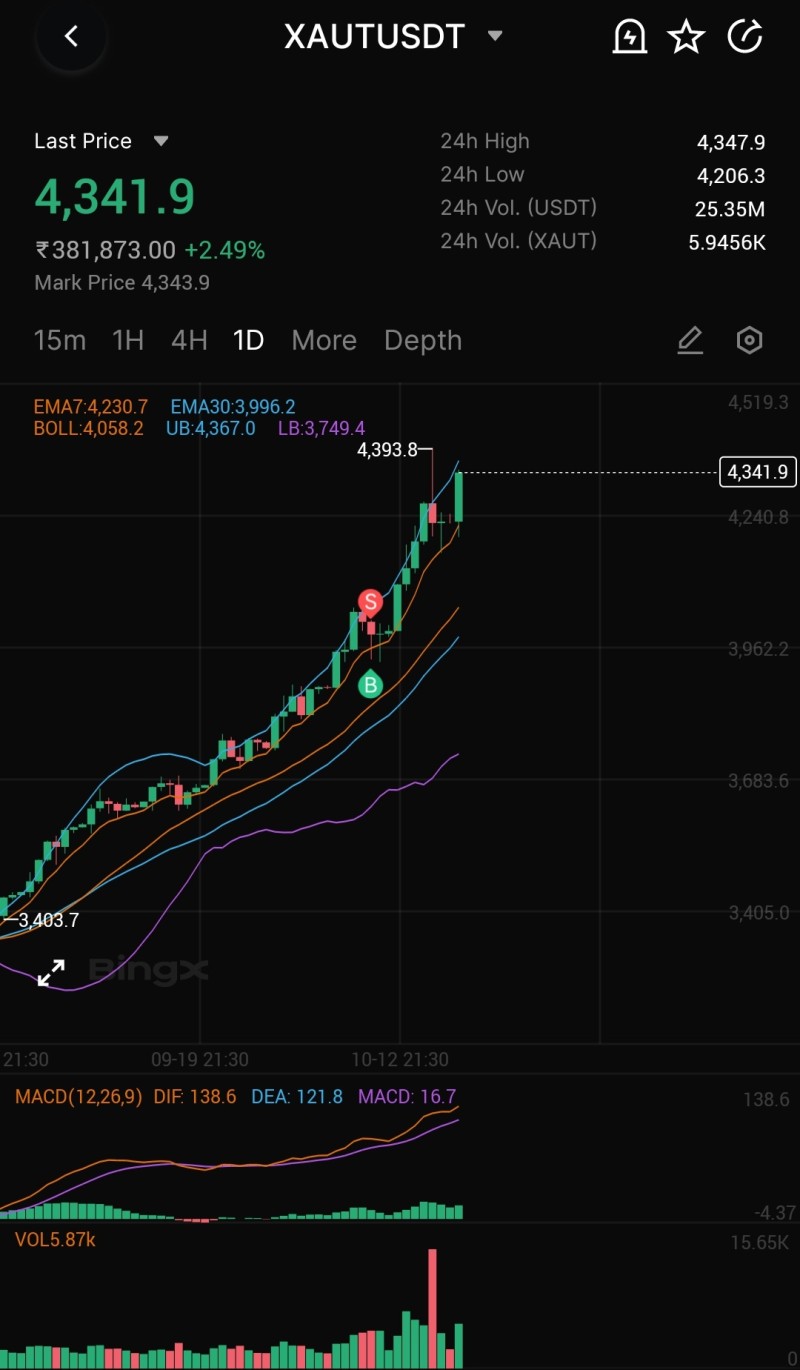
Gold's structure stays firmly bullish. Right now, XAU/USDT sits around $4,341.9, backed by solid upward pressure since breaking past $3,400 back in mid-September. The 24-hour high touched $4,347.9 while the low reached $4,206.3. Short-term support comes in at the EMA7 around $4,230.7, with the EMA30 at $3,996.2 providing a foundation for the broader trend. The upper Bollinger Band sits at $4,367, which price is now testing, while the lower band rests far below at $3,749.4.
What stands out is how price has been riding along that upper Bollinger Band, which confirms the uptrend but also hints at possible overheating. The latest candle closed just beneath the previous local peak at $4,393.8, suggesting this zone might act as near-term resistance.
Momentum Shows Strength but Early Warning Signs
The MACD stays positive with the MACD line sitting above its signal line, which typically signals bullish conditions. Yet the space between these lines has started narrowing, hinting that momentum might be reaching its peak. Volume tells an interesting story too. After a strong surge, activity has begun tapering off, which often means buying pressure is easing as some traders start taking profits. When volume drops while prices stay elevated, it can mark the beginning of a trend slowdown.
Several forces are pushing gold upward. Rising geopolitical tensions and energy market uncertainty have boosted demand for gold as a safe haven. U.S. bond yields have eased slightly, making non-yielding assets like gold more attractive. The dollar has pulled back a bit, giving additional support to XAU prices. On top of that, both retail and institutional traders have jumped into the rally, adding fuel to the parabolic move visible on the chart.
While these fundamental factors remain supportive, gold's near-vertical climb suggests short-term positioning may have gotten ahead of itself, leaving room for a technical breather.
Resistance: The $4,347 to $4,393 range marks the previous high and upper Bollinger limit where profit-taking could intensify. Support 1: Around $4,230, the EMA7 provides dynamic support. Support 2: The $4,058 to $4,060 zone aligns with the Bollinger mid-band and represents the base of the recent leg higher. Support 3: The EMA30 at $3,996 underpins the broader trend.
If gold struggles to push convincingly above $4,350, a healthy retracement toward $4,200 or even $4,060 could unfold over the next few sessions. That's where buyers who missed the initial move might step back in.
 Usman Salis