 Usman Salis

⬤ Gold is holding firm above its EMA 50 dynamic support after staging a sharp V-shaped recovery on the daily chart. The recent dip was quickly bought back as price returned above the moving average and found its footing. The V-recovery above EMA 50 keeps the bullish framework intact as long as this level continues to hold.
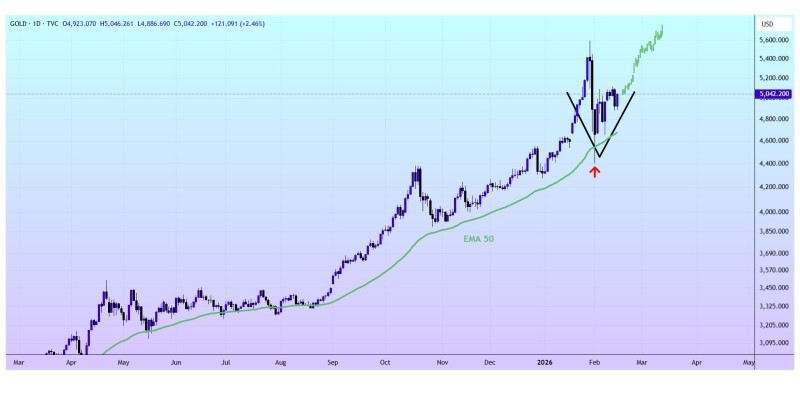
⬤ The chart reveals a steady uptrend followed by a brief pullback toward the moving average before buyers regained control. Price snapped back quickly and resumed trading near recent highs, highlighting the EMA 50's role as a critical technical anchor. Similar price action can be seen in holding above rising support.
⬤ The setup points to continuation potential only if the level keeps acting as support. A break below the moving average would compromise the structure, while holding it leaves the door open for another push higher. Comparable rebounds are covered in bounce from recent lows.
⬤ This matters because dynamic support levels typically determine whether momentum continues or fades. How the market behaves around the moving average will decide if the recent recovery extends into continuation or shifts into consolidation mode.
 Usman Salis


