 Usman Salis

⬤ Gold isn't just hitting high prices—it's closing in on a critical technical threshold when measured against US equities. Long-term ratio analysis shows gold approaching resistance levels last seen during its 2011 peak relative to the Dow Jones Industrial Average. The current setup has gold around $4,600 with the Dow near 49,500, and the pattern suggests something significant may be brewing.
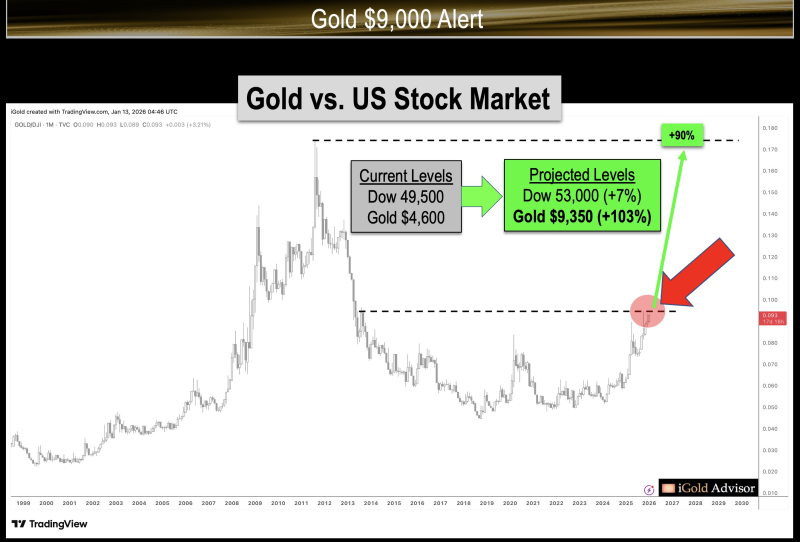
⬤ Here's where it gets interesting: the next major resistance on the gold-to-stocks ratio matches the 2011 high, representing roughly a 90 percent relative gain for gold versus equities. The projection assumes modest stock market growth—with the Dow climbing to about 53,000 (up 7 percent) over the next 18 months. But gold? It could rocket to approximately $9,350 per ounce, more than doubling from current levels.
⬤ What makes this scenario compelling is that it doesn't require a stock market collapse. It's based on gold simply outperforming equities while both move higher. Historically, when gold breaks out against stocks, it signals shifting macroeconomic conditions and investors rotating from financial assets into hard assets. These aren't random moves—they reflect deeper capital allocation trends.
⬤ A confirmed breakout would mean investors are piling into gold even as equity markets stay elevated. If the ratio reaches projected levels, we're looking at a fundamental shift in long-term market dynamics that could reshape how people view currencies, inflation protection, and gold's role as a store of value. The coming months will determine whether gold can clear this decades-long resistance and make this scenario reality.
 Usman Salis


