Usman Salis

⬤ Gold (XAUUSD) now trades inside a symmetrical triangle whose upper and lower borders draw closer each session. The metal shuttles between those converging lines - the last quote sits near $4,133. Each new high lands lower than the one before, each low lands higher - the range narrows and pressure builds while traders wait for price to punch through one side.
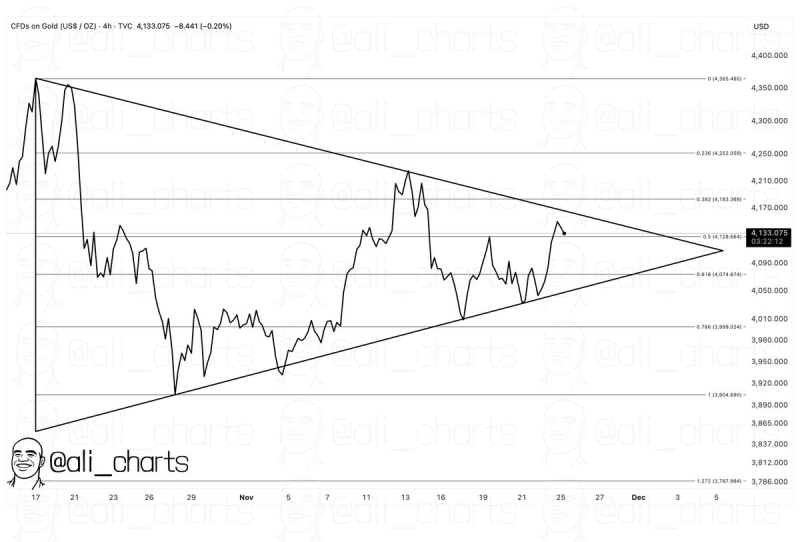
⬤ The lower line of the triangle lies at $4,041; the upper line sits at $4,180. Price has touched both levels more than once. Those two numbers line up with 38.2 % plus 61.8 % Fibonacci retracements of the prior swing - they carry extra weight. Yesterday's candle closed near the mid-point - buyers stepped in but lacked force to reach the top. Until a closing bar lands outside the pattern, the market stays locked.
A clean daily close above $4,180 would target the next major resistance cluster near $4,560. A daily close beneath $4,041 would expose the $3,700 region.
⬤ The distance between the first swing high and the first swing low inside the triangle measures about ten per cent of the spot price. Whichever side gives way first, the follow through move often stretches by that same distance. Volatility has dropped to a three month low - option desks quote one week straddles at 18 %, a sign that a larger move is expected.
⬤ The pattern carries weight because gold habitually explodes after long squeezes. A break to the top would drag real yields lower, weaken the dollar index and lift inflation expectations. A break to the bottom would do the reverse. With price now within days of the triangle tip, desks have trimmed leverage but also broadened stops in preparation for the expansion that should set the tone for the rest of the quarter.
 Usman Salis