 Usman Salis

⬤ Gold has entered a consolidation phase after surging $900 from its recent ascending-triangle breakout on the weekly chart. The pattern completed in early September, driving prices into the $4,000 range even faster than the previous 2024 breakout.
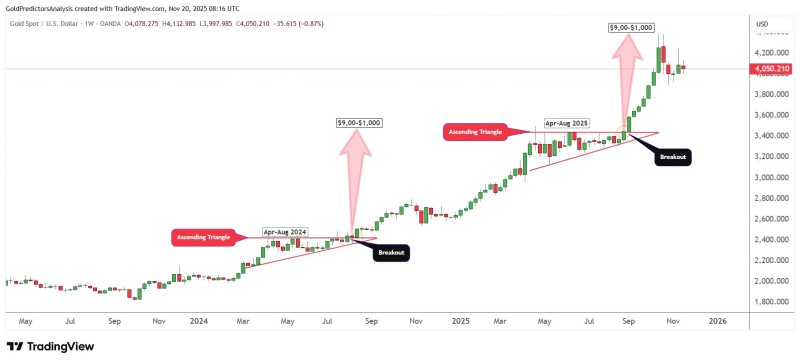
⬤ The chart shows a repeating pattern: an ascending triangle forms over several months, breaks out, then extends sharply higher. The earlier pattern from April to August 2024 pushed toward $3,000 levels. The latest structure from April to August 2025 mirrored that setup, with the rally reaching $4,000 to $4,200 in near-parabolic fashion. Each breakout appears to happen faster and with greater force than the last.
⬤ Price action now shows gold holding just below recent highs in a consolidation range. Both breakouts are clearly marked on the chart, highlighting the symmetry between the two major moves. Gold sits above long-term support trendlines, and clearing $4,400 could trigger another strong leg higher.
⬤ This setup matters because gold often accelerates in waves within parabolic structures. The repeating triangle-breakout pattern adds weight to the current momentum. If gold pushes through and holds above $4,400, the technical picture suggests another rally could be in the cards with potential for fresh record highs.
 Usman Salis


