 Marina Lyubimova

⬤ Copper's been stuck under a clear resistance zone on the daily chart, failing to make any real progress higher. Every time price tries to push through, sellers step in and knock it back down. The chart shows multiple failed attempts at this level, making it obvious that supply keeps overwhelming demand whenever copper approaches this area.
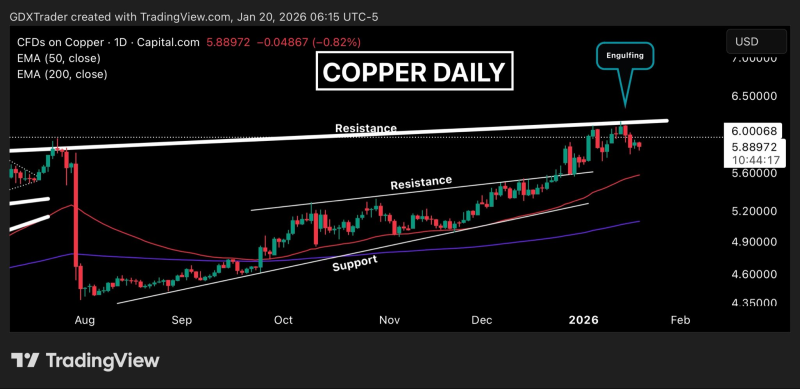
⬤ Last week's candle action tells the story pretty clearly. After several days of indecision candles showing the market couldn't pick a direction, a big bearish engulfing candle appeared—classic distribution behavior. This pattern usually shows up when sellers are unloading positions after the market tries and fails to stabilize. Bears kept control and shut down any breakout attempts above resistance.
⬤ What happened next just confirmed the bearish setup. An inside-range candle showed the market compressing and hesitating, but there wasn't any real buying interest behind it. Then sellers came back with a continuation candle that pushed price lower again, proving they're still running the show.
⬤ This matters beyond just copper itself. Traders watch copper as a gauge for industrial demand and overall economic strength. When it can't break resistance and keeps showing weakness, that sentiment bleeds into other base metals and related sectors. Until price either drops back to find better support or actually breaks above resistance and holds it, the technical setup points to limited upside and suggests staying cautious in the short term.
 Marina Lyubimova


