 Eseandre Mordi

⬤ Bravada Gold Corporation (BVA) just broke free from a 10-year price pattern that's been holding it back since 2016. The breakout happened in late December 2025, and the stock wasted no time—it's already up almost 150% in just one month. The technical setup suggests a measured move target of $0.42, which would mean roughly a 6x increase from where it's trading now.
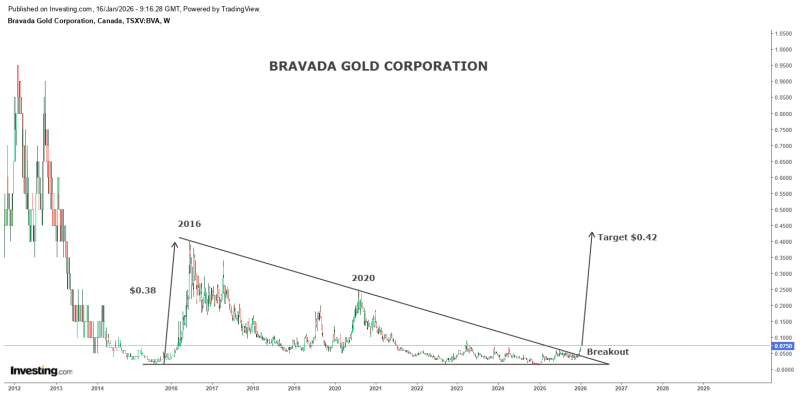
⬤ What makes this interesting is the history. Back in 2016, BVA went on an absolute tear, rallying 1200% in just six months before settling into that long consolidation. Now the technical conditions look strikingly similar to that earlier setup. The measured move calculation based on the pattern's height gives us that $0.42 target—a level that would represent serious upside if it plays out.
⬤ We're still in the early innings of this move, which means there's room for more gains if the momentum holds up. The key will be whether buyers keep showing up and whether the broader market cooperates. As BVA approaches resistance levels, it'll likely attract more attention from traders looking for the next big mover. Of course, any weakness in the overall market could put a damper on things.
⬤ Beyond just being a solid technical play, BVA's breakout could be a signal for other stocks stuck in similar long-term patterns. If it hits that $0.42 mark, it might get people looking harder at the resource sector and hunting for the next consolidation breakout. Sometimes one stock breaking out gets the ball rolling for others in the same space.
 Eseandre Mordi


