 Saad Ullah
⬤ Zeta Global Holdings Corp shares are catching fire as the daily chart reveals a tightening bullish pattern after months of sideways action. The stock is currently trading in the $21–$23 range after climbing steadily from its mid-year lows, with technical signals pointing toward a potential breakout.
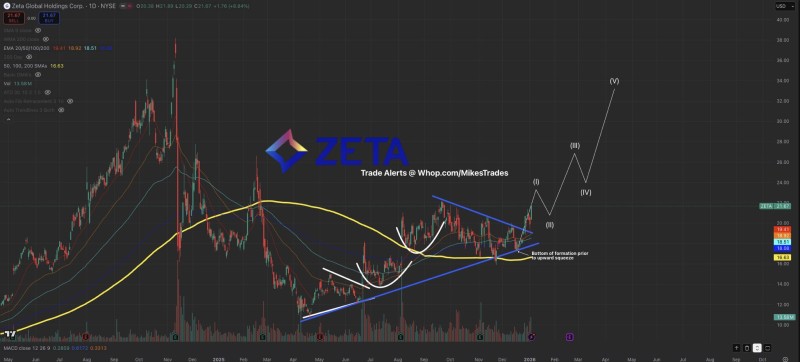
⬤ The chart shows a rising wedge formation with higher lows and price consolidating near converging trendlines and key moving averages. This setup typically indicates reduced volatility and steady accumulation before a major move. ZETA is holding above its longer-term moving averages, with recent price action showing improving momentum as it tries to push into higher territory.
⬤ The bullish case gets stronger when looking at fundamentals. Zeta Global is sitting on approximately $360 million in cash and posted roughly 42 percent year-over-year revenue growth. Company insiders have also been buying shares, signaling confidence in the business outlook and future valuation expansion.
⬤ This setup matters for the broader market as it reflects renewed interest in mid-cap growth stocks after an extended consolidation period. If ZETA maintains current support and breaks higher, it could spark positive momentum across data-driven marketing and software stocks. However, failure to hold these levels would suggest caution is still needed. The next few weeks will be critical in determining whether this pattern leads to a sustained rally or another pause.
 Saad Ullah


