 Victoria Bazir
⬤ Zeta Global Holdings Corp. (ZETA) took a hit in the latest session, dropping over 6% as shares pulled back from recent highs around $25–$26 down to the low $20s. The sharp decline shows increased selling pressure after a solid run-up, with the daily chart displaying a notable bearish candle that's caught traders' attention.
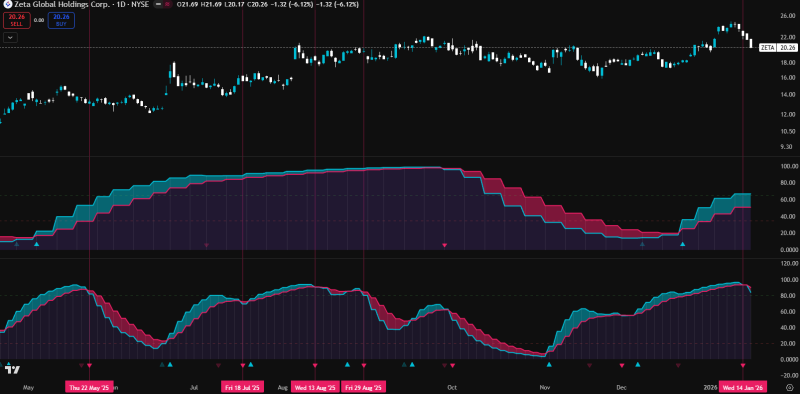
⬤ The fast Stochastic indicator has turned downward from elevated levels—a pattern that's historically led to either quick 7% pullbacks or sideways consolidation in ZETA. This momentum shift suggests the stock is cooling off rather than facing a major trend reversal. Previous similar signals resulted in brief consolidation periods before the stock resumed its move.
⬤ Despite the selloff, ZETA is still trading above key support zones from its mid-year rally. The stock climbed steadily from the low teens into the mid-20s before this retracement, maintaining a pattern of higher highs and higher lows. The current pullback is bringing prices closer to former support areas that previously launched upward moves, while momentum indicators haven't reached deeply oversold levels yet.
⬤ This matters because ZETA has been a standout performer in its sector recently. When market leaders show weakness after extended rallies, it can shift sentiment across similar stocks. Whether ZETA stabilizes here or continues pulling back will likely signal if this is just a breather or something more significant for the short-term trend.
 Victoria Bazir


