 Usman Salis

Zeta Global Holdings Corp. (ZETA) is facing mounting pressure as shares tumble roughly 16% following a failed attempt to hold above critical support zones. The stock's daily chart reveals an evolving megaphone pattern that technical analysts are watching closely, with the next trading session potentially determining whether shares bounce toward $25 or extend their recent decline.
ZETA Stock Tests Lower Boundary After 16% Decline
Zeta Global (ZETA) has weakened considerably after rejection at its bull market support band, with price action sliding toward the mid-$14 area in recent sessions. According to recent chart analysis, the stock currently trades near $14.98 after experiencing a sharp daily drop that brought shares to the lower boundary of a widening formation. The previous range highs remain well above current price levels, creating a significant gap that bulls will need to reclaim.
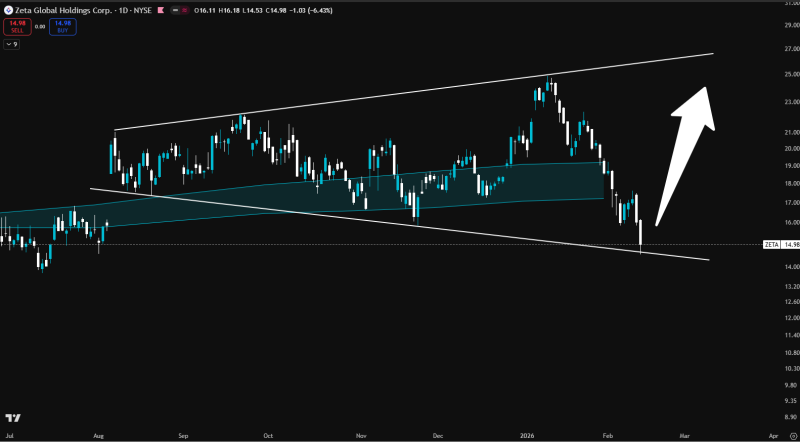
The developing technical structure resembles a megaphone pattern, characterized by expanding swings between a rising upper boundary and a falling lower boundary. ZETA previously traded in the low-to-mid $20s before rotating lower and accelerating downward through February, pushing the stock back to its lower trendline support area. This weakness ties directly to the stock's earlier struggles at key trend levels, as detailed in ZETA stock rejection at the bull market support band.
The next session is key for direction," noted the analyst tracking the megaphone formation.
Why the $25+ Target Matters for Zeta Global
While the technical setup frames a potential reversal scenario, the chart still shows the pattern as "forming" rather than confirmed. The upside reference level sits at $25+, which aligns with the upper boundary zone of the broadening range visible on recent charts. However, this bullish outcome depends heavily on whether the lower boundary holds and whether follow-through buying materializes in upcoming sessions.
Additional context on downside extensions and critical decision points near the mid-$14 zone appears in coverage of Zeta Global testing 1.618 support after a sharp drop and analysis of ZETA stock's "make-or-break" week at key support.
What Broadening Patterns Mean for ZETA's Next Move
The significance of this development lies in what broadening formations typically signal—heightened disagreement between buyers and sellers, where volatility expands before the market chooses its next directional leg. If Zeta Global (ZETA) manages to stabilize at the lower boundary, the chart-based roadmap leaves room for a rotation back toward the mid-$20s range. Conversely, if support fails to hold, the current corrective phase would likely remain intact and could extend further before any meaningful recovery attempt takes shape.
Traders and investors are now watching whether ZETA can defend current levels or whether additional downside remains before the stock establishes a more durable bottom.
 Usman Salis


