Usman Salis
⬤ Tesla is consolidating near $435, testing a well-defined resistance zone around $450. The daily chart reveals a developing inverse head-and-shoulders pattern with the neckline positioned right at this key level. Price has been building higher lows inside an upward-sloping channel, showing strength after pulling back from recent highs.
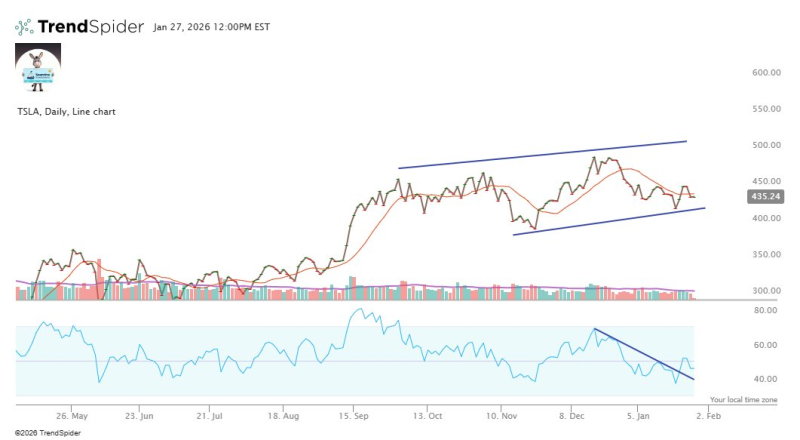
⬤ The technical setup shows TSLA maintaining a clean ascending channel structure over recent months. The inverse head-and-shoulders formation signals building momentum if price can push through and hold above $450. Moving averages continue providing support, confirming the structure hasn't broken down.
The chart shows a developing inverse head-and-shoulders pattern, with the neckline aligned around $450.
⬤ Breaking above $450 opens the door to a potential run toward $500, which lines up with previous resistance zones. That's the upside target if bulls can confirm the breakout. On the flip side, the pattern stays intact as long as price holds above $420—the lower boundary of the rising channel.
⬤ This matters because Tesla carries serious weight in the broader market. When a high-beta name like this coils up near major resistance, volatility tends to spike. Whether $450 breaks or rejects will likely set the tone for TSLA's next leg and could ripple across growth stocks more broadly.
 Usman Salis