 Eseandre Mordi

⬤ Tesla (TSLA) is hanging around an important technical barrier after a solid rally, with the price pushing against a clearly defined resistance "lid" on the daily chart. The stock closed near $485 on December 24, with the Relative Strength Index sitting above 60—showing healthy momentum without being stretched. At the same time, a rising trendline from mid-year lows is still holding up, which keeps the broader upward structure intact.
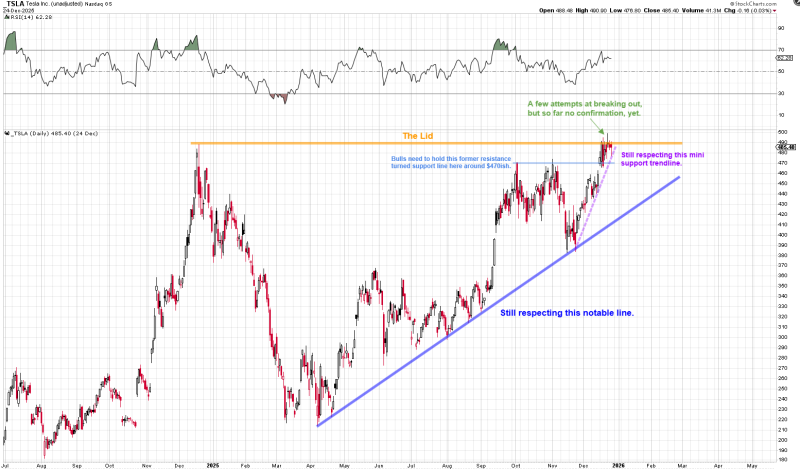
⬤ The chart shows Tesla making several runs at the resistance band just below $500, though it hasn't managed a clean break yet. A smaller upward-sloping support line beneath recent price action suggests buyers are still active in the short term, while the old resistance zone around $470 now looks like it's flipped to support. Bulls need to hold this $470 area to keep the current technical setup alive.
⬤ Over the past few months, TSLA has followed a notable long-term rising trendline that's guided its recovery, even with some bumps along the way. The upper resistance band—called "The Lid"—marks the area where rallies have repeatedly hit a wall. The RSI trend shows steady positive sentiment without getting overheated. Right now, Tesla stock is basically stuck between solid rising support below and stubborn resistance overhead.
⬤ This setup matters because Tesla remains one of the most watched stocks in the market, and what happens with TSLA often sets the tone for broader growth and tech sentiment. With price sitting just under key resistance while holding trend support, the next move probably depends on whether buyers can keep defending support levels and slowly build momentum—or risk breaking the uptrend structure if they can't.
 Eseandre Mordi


