Usman Salis

⬤ Tesla (TSLA) is catching serious attention from technical traders as the stock consolidates near major chart levels following its impressive multi-month recovery. The monthly chart reveals a massive rounding pattern that's been forming since 2022, with price now hovering near old resistance zones. Market watchers are pointing out there's not much downside cushion before bulls need to step up and defend the $421 level—a critical support area that could determine the stock's next move. Tesla wrapped up its most recent session at $438.07 after dipping to an intraday low of $435.30.
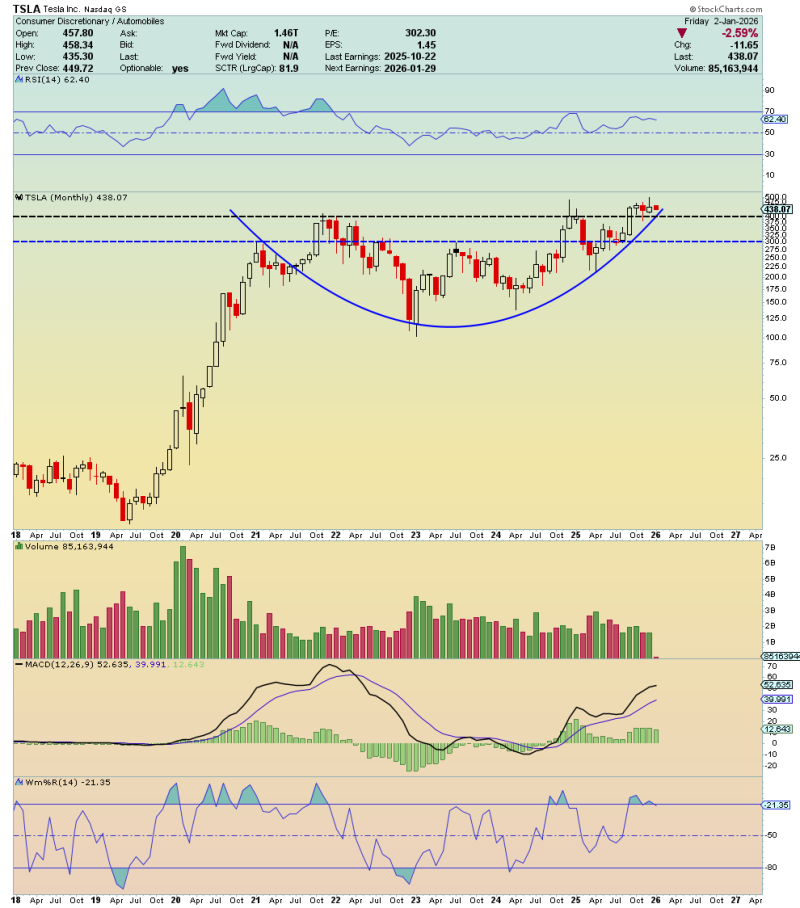
⬤ Technical analysts are eyeing January's monthly close with particular interest. A finish above $452 would be seen as a solid bullish signal for the longer-term outlook. Right now, TSLA is trading comfortably above its key moving averages, while the RSI sits in the low-60 range—showing healthy positive momentum without being stretched into overbought territory. Volume has held relatively steady compared to previous months, and the MACD indicator continues trending in positive territory, backing up the broader recovery story that's been playing out since the 2023 lows.
⬤ The $450 region has been tested multiple times over the past few years, making this current trading zone a crucial battleground for market sentiment. Holding above $421 would signal that Tesla's longer-term bullish structure is still intact, while a break below could open the door to renewed selling pressure. On the flip side, closing January above $452 would confirm that TSLA has successfully flipped prior resistance into support and is maintaining its upward trajectory on the higher timeframes.
⬤ Tesla's January close is drawing outsized attention as one of the market's most-watched large-cap stocks hits a critical inflection point. With broader markets still navigating shifting macro conditions and rate expectations, how Tesla performs at these key levels could set the tone for sentiment across the growth and technology sector.
 Usman Salis