 Marina Lyubimova

⬤ Tesla (TSLA) is trying to find its footing after a recent slide, with the hourly chart flashing oversold signals while the RSI forms a bullish divergence. The stock's currently hanging around the mid-$450s, and momentum indicators are starting to shift. What's interesting is that a similar setup played out earlier this month and led to a bounce, so traders are watching to see if history might repeat itself.
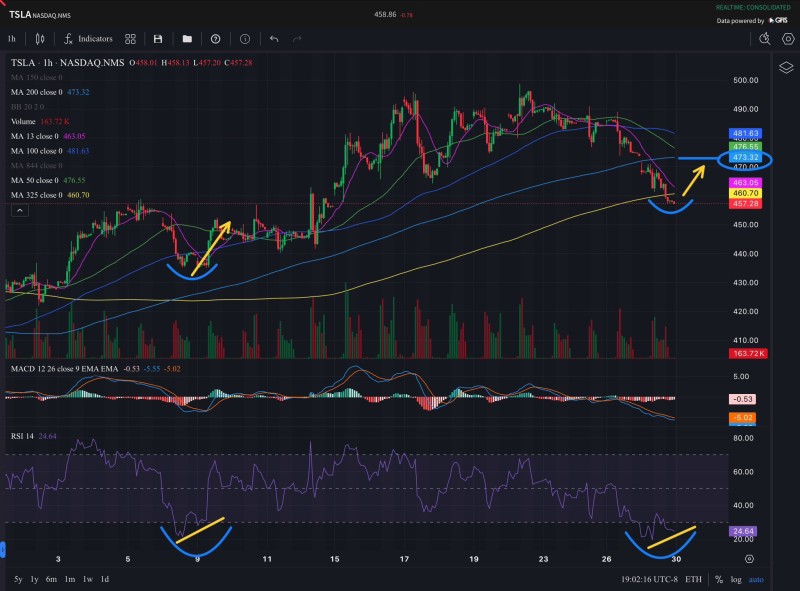
⬤ The chart shows Tesla dipping into the $457–$458 zone on the latest hourly candle, with the RSI dropping to about 24 before carving out a higher low. Meanwhile, price action made a lower low—that's the divergence you see marked with arrows on both the RSI and price panels. TSLA's also testing the 325-period simple moving average on the hourly timeframe, which has previously held as support during pullbacks. There's a rounded price pattern forming near current levels, hinting that a base might be taking shape.
⬤ The target zone sits between roughly $470 and $473, marked in blue near the 200-period simple moving average on the hourly chart. If the RSI divergence holds and oversold conditions start to ease, a bounce toward that 200SMA makes sense from a technical standpoint. The left side of the chart shows a previous instance where a similar RSI pattern and rounded price low preceded an upward move, which is why this comparison is getting attention.
⬤ This setup matters because Tesla remains one of the most heavily traded large-cap names out there. Short-term momentum shifts like RSI divergence can swing near-term sentiment around TSLA pretty quickly. How the stock handles this support area and whether it can push toward that $470–$473 zone could set the tone for broader trading activity in the EV and tech space as market participants keep tabs on these key technical levels.
 Marina Lyubimova


