Eseandre Mordi

⬤ Tesla (TSLA) closed at around $485.40 on December 24, 2025, after briefly dipping below an ascending triangle pattern during the session before recovering back inside the formation by day's end. The stock faces key resistance near $500, which has rejected multiple breakout attempts throughout December.
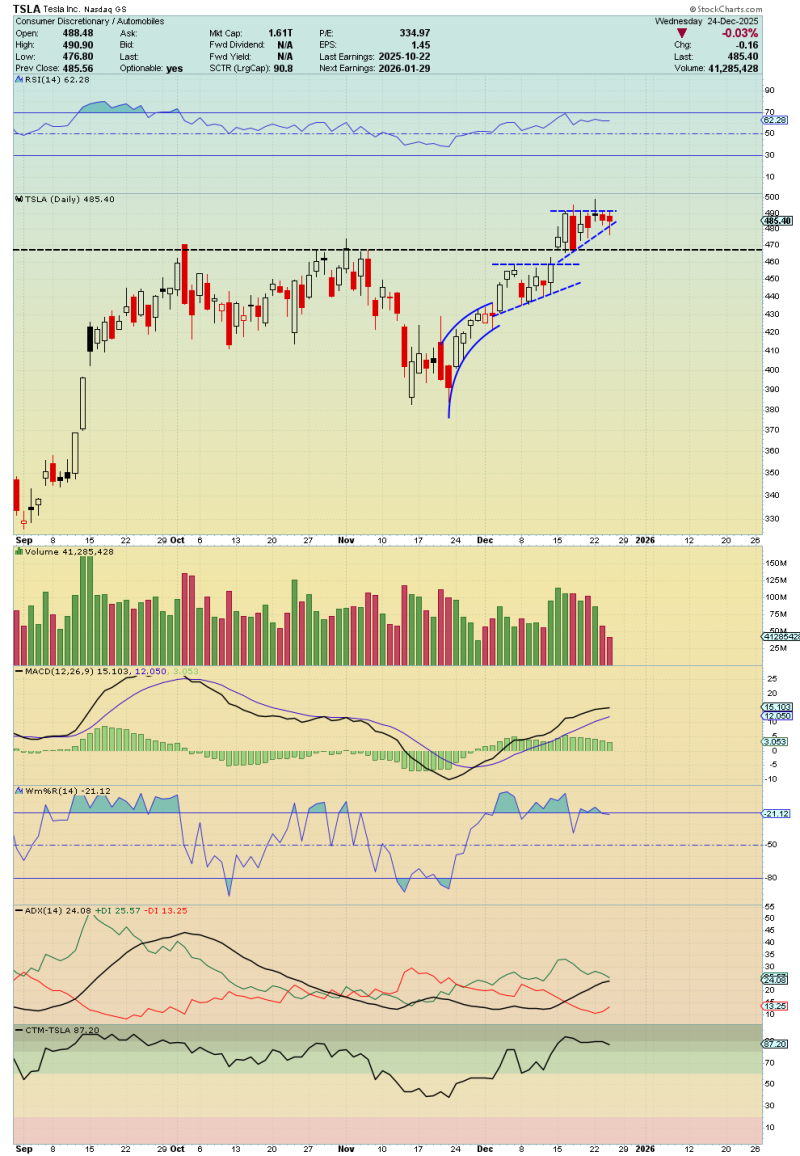
⬤ TSLA slipped out of the ascending triangle setup intraday but managed to close back within the range, keeping the bullish pattern alive. Market participants are watching a massive call wall near the $500 strike worth over $520 million in notional value. If momentum continues, traders expect a potential move toward the $516–$522 zone before year end.
⬤ The daily chart shows a solid recovery trend since late November, with Tesla establishing higher lows on the timeframe. The RSI sits above 60, signaling healthy bullish momentum without extreme overbought conditions. The MACD remains above its signal line with positive histogram bars, confirming the upward trend. Trading volumes have moderated from earlier December peaks but remain respectable as TSLA hovers near multi-month highs.
⬤ This price action is significant because Tesla is consolidating just beneath a psychologically important level while maintaining its technical structure. A clean break and hold above this range could fuel bullish sentiment into 2026, while a breakdown below the pattern might trigger short-term volatility and shift focus back to nearby support zones.
 Eseandre Mordi