 Usman Salis

⬤ Tesla shares have settled into a sideways pattern after pushing past the $400 mark, currently trading around $449 on the weekly chart. While some traders see this as "dead money," the technical setup tells a different story—this looks more like healthy consolidation than a breakdown.
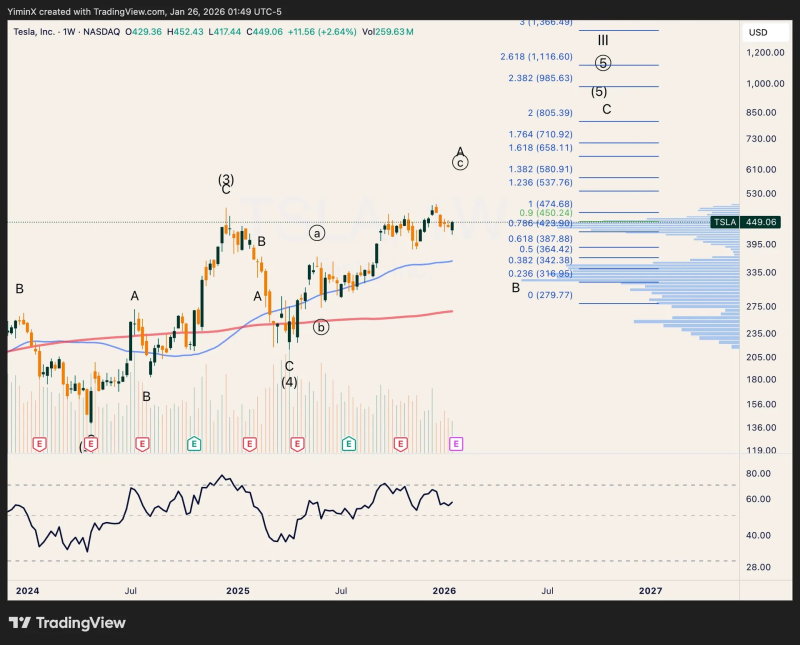
⬤ The stock is holding comfortably above its key moving averages, staying supported by the uptrend that kicked off earlier this year. Price action has tightened into a defined range, which is typical after big directional moves. This structure matches what chart watchers call a bull flag—momentum takes a breather, but the underlying trend stays intact.
⬤ Fibonacci levels mapped on the chart point to several important zones, including a possible run toward $540 if the rally picks back up. Volume analysis shows heavy trading activity clustered around current prices, confirming that buyers and sellers are temporarily in equilibrium. Weekly momentum indicators remain steady, showing no real signs of sustained selling pressure during this pause.
⬤ As long as TSLA stays above the $400 zone, the technical picture supports viewing this as a pause within an uptrend, not the end of one. How this range resolves—whether it breaks higher or lower—will likely signal where the stock heads next in the near term.
 Usman Salis


