 Saad Ullah

The stock market's headline numbers tell a feel-good story, but dig deeper and you'll find something unsettling. A revealing new chart exposes the S&P 500's uncomfortable truth: nearly all market gains come from just 10 companies, while the remaining 490 are essentially treading water.
The Tale of Two Markets
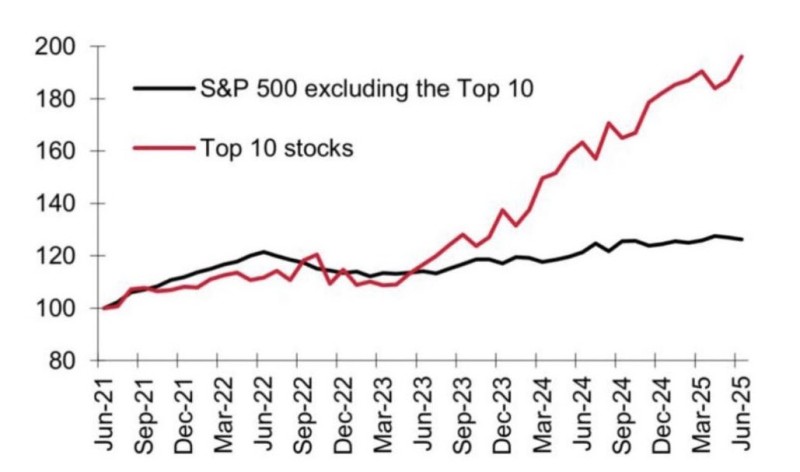
The top 10 S&P 500 stocks have rocketed from 100 to nearly 190 since June 2021, with most gains happening after mid-2023 during the AI boom. Meanwhile, the other 490 companies barely moved - crawling from 100 to just 120 over the same period. That's roughly 20% over four years, which barely beats inflation.
We're talking about 490 companies across every sector, and collectively they've gone nowhere. It's like Corporate America hit pause while tech giants ran the show.
The Risk Nobody Talks About
When 10 stocks carry the entire market, what happens when they stumble? We're betting everything on a handful of companies delivering miracle growth forever. History suggests that's not sustainable.
This creates a massive vulnerability that most investors don't fully appreciate. When 10 stocks carry the entire market on their shoulders, what happens when they stumble? We're essentially betting the farm on a handful of companies to keep delivering miracle growth forever.
History suggests that's not a great long-term strategy. Markets work best when gains are broad-based, with companies across different sectors contributing to overall growth. What we have now looks more like a house of cards than a solid foundation.
The data comes from a compelling chart shared on social media, highlighting just how lopsided market performance has become. For investors relying on S&P 500 index funds, this concentration means they're getting far less diversification than they might think.
 Saad Ullah


