 Saad Ullah
The S&P 500 just hit a technical milestone that shows how strong this bull market really is. The chart reveals the index bouncing off that rising 50-day moving average repeatedly — those circled spots make it clear. Buyers have been stepping in every time the index approaches this trend line, and we're watching another test of this crucial support right now.
S&P 500 Stock Extends One of Its Strongest Technical Streaks
According to Barchart, the S&P 500 has closed above the 50-day moving average for 132 consecutive trading days — the third-longest streak since 1990. Only runs in 1995 and 2007 lasted longer. For market technicals, this signals strong, consistent buying pressure.
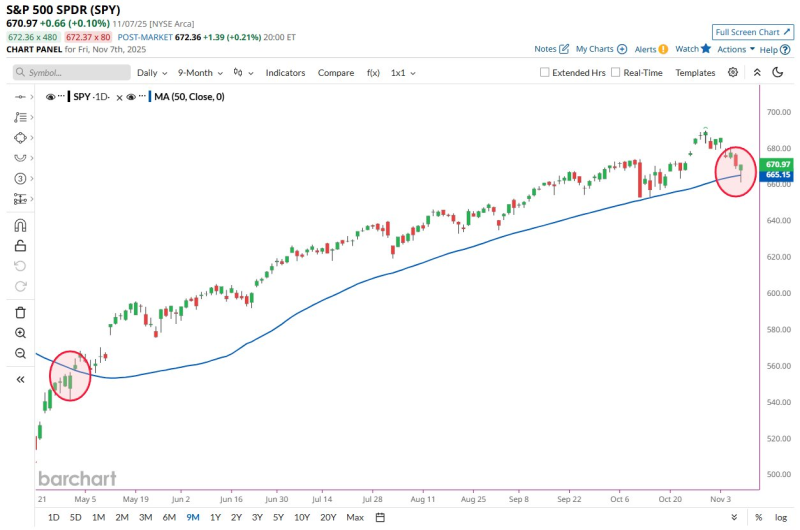
The chart confirms it. Throughout summer and fall, price action stayed above that 50-day line. Every dip toward it brought buyers back. That circled area on the right shows the index testing the trend line again, making the next few sessions worth watching.
Chart Analysis: SPY Tests the 50-Day Moving Average Again
Looking at the chart details:
- The 50-day moving average is climbing sharply, showing strong momentum
- Recent red candles represent a measured pullback, not selling panic
- The circled section on the right mirrors the earlier setup on the left
- Volume remains steady with no signs of capitulation
- The trend support stays intact unless we see a close below the moving average
This long-term strength combined with successful tests of the 50-day line suggests institutional players still see dips as buying opportunities.
Why This Matters for Investors
Extended runs above the 50-day moving average typically happen during strong macro cycles, backed by solid earnings, resilient economic data, and strong sector leadership — especially in tech and AI. But history shows that the first confirmed close below the 50-day average after a long streak can signal a shift in market dynamics.
Watch how SPY behaves around this trend line. A bounce extends the bull run. A sustained break below could mean a different market environment ahead.
Watching the Key Trend Level
If SPY bounces off the 50-day moving average again, this uptrend could continue into year-end, pushing toward new highs. But if support breaks, volatility could pick up as traders rethink positions.
The S&P 500 is riding one of the most resilient technical uptrends in decades. What happens at this trend line in coming sessions could set the market's tone heading into winter.
 Saad Ullah


