 Saad Ullah

⬤ Oracle Corporation (ORCL) is working through a significant consolidation phase on the monthly timeframe, hovering around a key liquidity zone. The latest chart shows ORCL stepping back from its 2025 peaks and finding its footing near an area where tons of trading activity previously took place—basically, the market's taking a breather to figure out what Oracle's really worth after that extended rally.
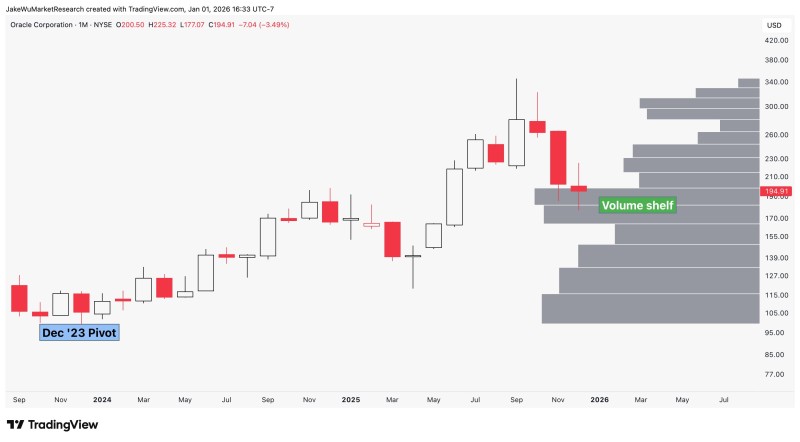
⬤ ORCL's carved out a prominent volume shelf on the monthly chart. Think of this zone as a price level where serious trading volume piled up in the past—it tends to act like structural support (or resistance) when the stock comes back to visit. The chart also flags the December 2023 pivot, which lines up nicely with today's support area as ORCL trades around $195 following several red monthly candles.
⬤ What's a volume shelf mean for traders? It's basically a price range where buyers and sellers were super active before—they reached a kind of equilibrium there. When ORCL retests this zone, it signals that meaningful trading interest is still alive and well. If buyers step up and demand holds strong, prices could stabilize or just hang out here for a bit. But if this level cracks? That shelf might flip into resistance, potentially shaping Oracle's next medium-term direction.
⬤ This setup matters because high-volume zones like this often decide whether a longer-term uptrend can keep its momentum rolling. Oracle's sitting right on one of these major balance areas on the monthly chart, which makes the stock extra sensitive to how earnings play out, what's happening with enterprise software spending, macro headwinds or tailwinds, and overall tech sector sentiment. How ORCL behaves around this volume shelf could very well set the stage for where it heads next.
 Saad Ullah


