 Saad Ullah

Oracle's stock is giving back gains after an impressive run. Shares climbed from roughly $150 in May to over $325 by September, but they're now pulling back hard.
Chart Breakdown
Trading around $284, the stock is approaching what StockSleuth calls "plot armor" support at $252. The chart shows Oracle has entered a pivotal technical moment, with moving averages and volume patterns highlighting the shift in momentum.
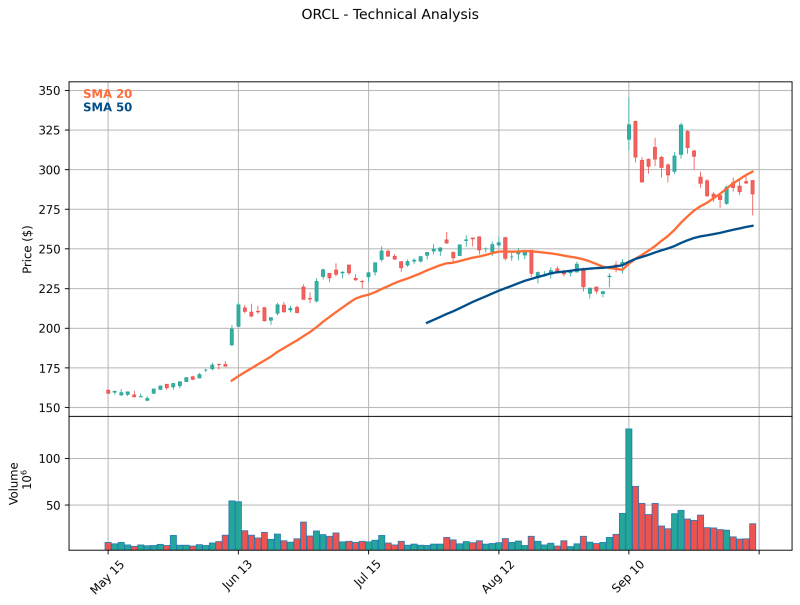
Price Movement: ORCL rallied strongly through summer before topping out above $325. It's now settled into the $280–$290 range, suggesting a deeper pullback may be underway. The 20-day moving average is starting to roll over, showing weakening short-term momentum, while the 50-day average is still climbing but now at risk as price drifts toward it. Immediate resistance sits around $300–$310, where recent bounce attempts have stalled. Current support is holding in the $275–$280 zone, though it's under pressure. The critical level to watch is $252, which lines up with the 50-day average and represents a make-or-break point for bulls. Volume spiked dramatically in September at the peak and again during the initial drop, confirming heavy profit-taking and possible institutional selling.
What's Driving the Decline?
The drop follows natural profit-taking after the explosive rally above $300. There's also been a broader sector rotation, with money flowing out of big tech and into defensive plays like gold and energy. Rising interest rates and tighter corporate IT budgets have added uncertainty around enterprise software demand. And perhaps most importantly, Oracle's sharp gains stretched valuations to levels that invited skepticism about whether the rally could continue.
If $252 holds, the longer-term uptrend stays intact and bulls keep control. But if that level breaks, we could see a deeper slide toward $225–$230. On the flip side, a move back above $300 would signal renewed strength and open the door to retesting those September highs.
 Saad Ullah


