 Artem Voloskovets
⬤ ORCL had a solid session, extending its recent rebound and climbing back toward a major technical resistance area around the $200 mark. The daily chart shows Oracle closing near $197.7 after a sharp gain—just below a level that's acted as a ceiling before. The latest move shows growing bullish pressure as ORCL approaches this key threshold.
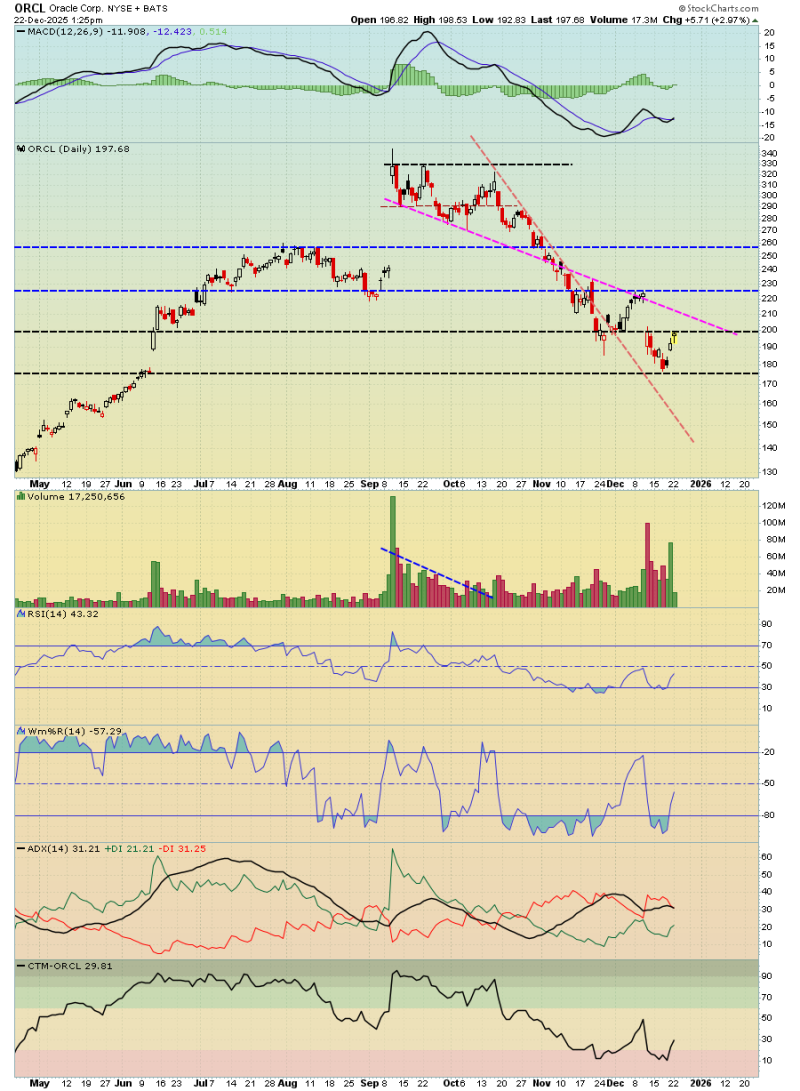
⬤ Earlier this year, Oracle went on a strong run that pushed the stock above $300 before a sustained correction kicked in. That decline played out within a downward sloping channel, with price dropping back toward long-term support around $180. Recent action shows ORCL bouncing from that area and steadily advancing, bringing the stock back into a technically important zone where sellers showed up previously.
⬤ The chart points to improving short-term momentum, with recent candles showing stronger buying interest than earlier sessions. Volume picked up during the latest advance, suggesting more traders are jumping in as price moves higher. At the same time, ORCL is now approaching that convergence of resistance—making this current area a critical zone to watch closely.
⬤ Why does this matter? ORCL is trading at a level that could determine the next phase of its trend. A sustained break above $200 would confirm the recovery after months of consolidation, while hesitation near resistance could mean more sideways trading ahead. The current setup shows how Oracle's price action at major technical levels can shape broader sentiment around large-cap tech stocks.
 Artem Voloskovets


