 Eseandre Mordi

⬤ Oracle Corp. (ORCL) just printed a Death Cross on its daily chart—the 50-day moving average slipped below the 200-day for the first time since April. This technical signal suggests the stock's long-term momentum may be weakening after months of selling pressure from recent peaks.
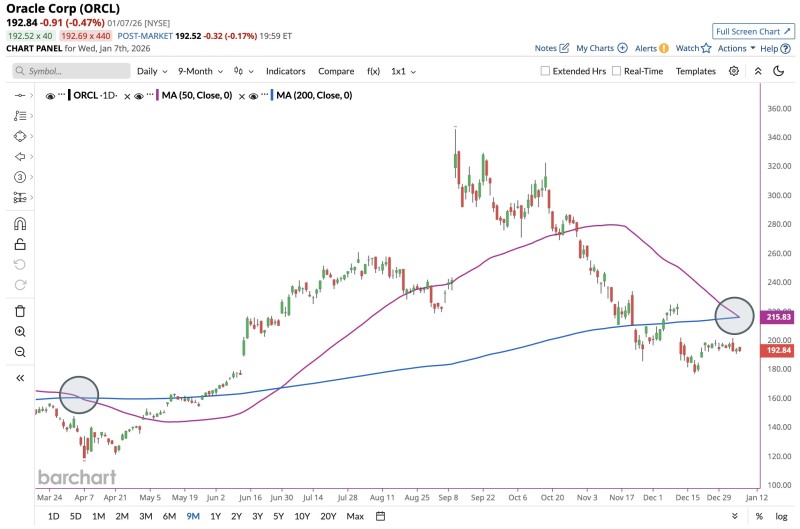
⬤ The chart shows Oracle topping out above $320 before sliding into a sustained downtrend in late 2025. The stock broke below its 50-day moving average and kept falling as that level rolled over and eventually crossed beneath the rising 200-day. The crossover happened with ORCL trading around $190–$200, putting the stock right at a critical long-term support zone rather than deep below it.
⬤ The last Death Cross in April formed near a local bottom, and Oracle rebounded strongly over the following months. While history doesn't guarantee a repeat, that comparison shows this signal has previously appeared during trend transitions rather than at momentum extremes. Recent candles show some stabilization with tighter ranges and less downside volatility than earlier in the selloff.
⬤ This matters for the broader market because Oracle is a large-cap tech name with major exposure to enterprise software and cloud infrastructure. Death Crosses typically draw attention from technical traders and algorithmic strategies, which can impact short-term positioning. Whether ORCL holds above its 200-day moving average or stays capped below it could influence sentiment toward big tech stocks and indicate whether this decline is turning into consolidation or continuing lower.
 Eseandre Mordi


