 Sergey Diakov

⬤ Oracle Corporation (ORCL) just wrapped up its monthly session sitting on a technically sketchy level that's got traders eyeing medium to long-term downside risk. The most recent monthly candle landed right at the lower edge of the red ribbon zone on the chart. That yellow candle isn't just noise—it's screaming caution, showing ORCL hit a spot where the whole trend could flip.
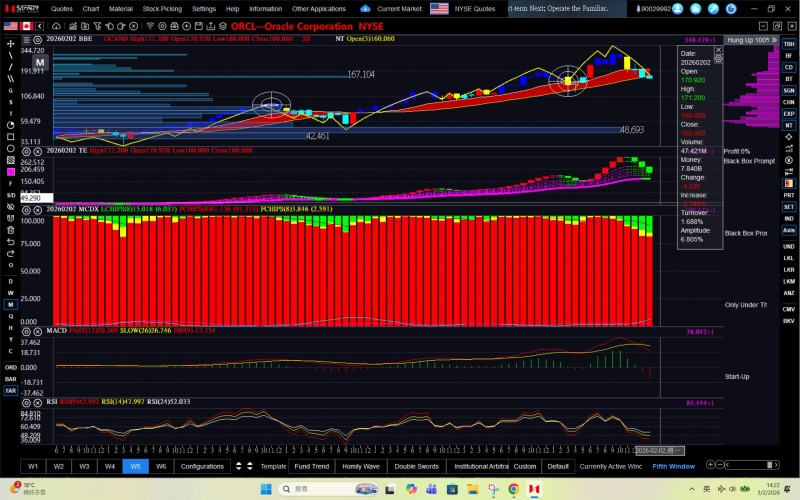
⬤ The monthly chart tells the story: ORCL pushed higher for a while but ran into serious selling pressure near recent peaks. This latest candle shows momentum clearly stalling out, with price unable to stick above that red ribbon zone. Closing near the lower boundary means buyers couldn't take back control before month-end. On monthly timeframes, these closes matter big time because they define major trend moves, not just day-to-day chop.
⬤ Structurally, ORCL's still inside its longer-term trend, but this setup is flashing warning signs. The red ribbon has been a make-or-break zone historically—price either bounces back up or slides into deeper pullbacks from here. With the monthly candle pressing right against this lower boundary, Oracle's sitting at a crossroads. Without a convincing bullish reversal coming soon, the technical picture keeps pointing toward downside risk ahead.

⬤ Monthly chart signals carry serious weight because they shape longer-term positioning and market sentiment. If ORCL fails to hold this zone, expect caution to spread and volatility to spike around the stock. A sharp bounce would clean up the technical outlook fast. Right now though, this monthly close puts all eyes on this level—Oracle's next move will likely set the trend direction well beyond the short term.
 Sergey Diakov


