Usman Salis
After an impressive rally that pushed Oracle to new peaks, the stock appears ready for a breather. The weekly chart is flashing early warning signs—bearish RSI divergence, a trendline retest, and an unfilled gap around $243 that could act as a short-term magnet. But here's the thing: the bigger picture is still bullish. Oracle's fundamentals are solid, and history shows it tends to pull back and fill gaps before climbing to new highs.
What the Chart Is Telling Us
Technical analyst MarketMaestro notes that Oracle "experienced a historic event" and reached levels where profit-taking made sense. The weekly chart reveals several technical clues about what might happen next:
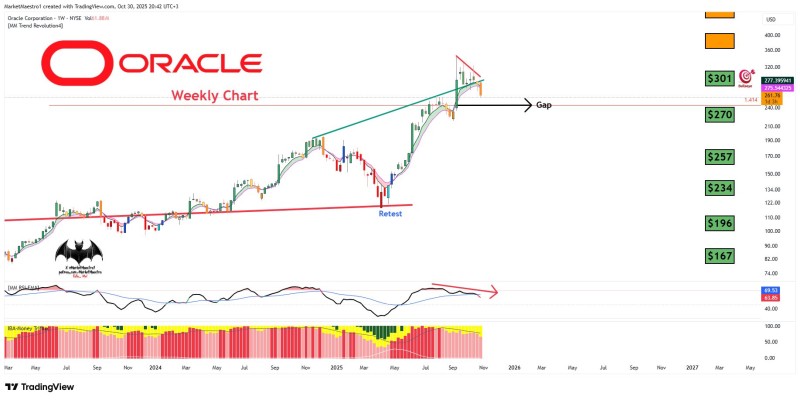
- Trendline Retest: After breaking above its rising resistance line, Oracle has pulled back to retest that zone around $270–$275—a normal and healthy move in strong trends.
- RSI Divergence: The Relative Strength Index has turned down while price made higher highs, a classic sign that momentum is fading.
- Key Price Levels: Recent resistance sits at $301, with immediate support near $270 and strong Fibonacci support at $257. The chart highlights an unfilled gap between $243–$234, which often acts as a target during corrections. Deeper structural supports exist around $196 and $167.
- Momentum Fade: The "Money Trend" indicator below the chart has shifted from yellow to red, confirming the cooling phase.
These signals point to a temporary correction—not a trend reversal. Gap-filling is common in bull markets as stocks retrace to rebalance liquidity before resuming their climb. Oracle has followed this pattern before: every major rally is followed by consolidation and retests before pushing higher again.
Long-Term View: Still Bullish
Despite near-term pullback risks, Oracle's big-picture chart remains decisively positive. The long-term rising trendline from 2022 is still intact, and the stock trades well above major support levels. Fundamentally, Oracle is benefiting from AI-driven cloud growth, strong enterprise software demand, and expanding margins.
Oracle's chart shows short-term technical weakness within a strong long-term uptrend. With RSI cooling and a possible retest toward the $243 gap zone, the stock looks like it's setting up for its next move rather than breaking down. If Oracle holds above its Fibonacci supports and completes this consolidation, a breakout above $301 could pave the way for new all-time highs in 2026. For long-term investors, this dip might be more opportunity than threat.
 Usman Salis