 Usman Salis

⬤ Oracle shares have been through the wringer lately, dropping about 49% over roughly 98 days. Now trading in the $195-$200 range, the stock seems to be catching its breath near recent lows. The daily chart shows selling might finally be losing steam as price action stabilizes around the bottom of a long downtrend channel. What's catching traders' eyes is how the recent candles suggest exhaustion rather than continued panic.
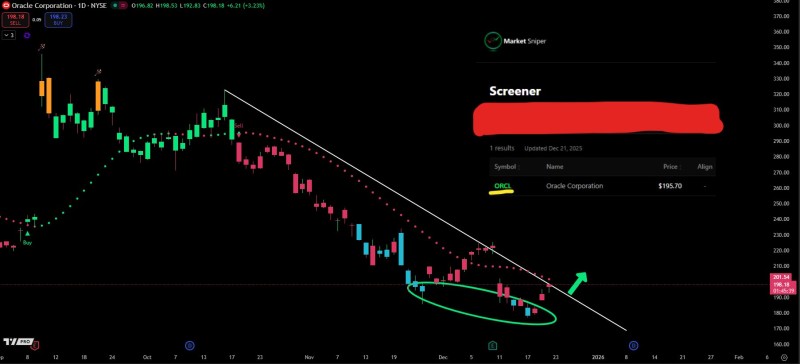
⬤ The stock is bumping up against a downtrend line that's been capping rallies since the peak. While ORCL is still trading beneath this resistance, the consolidation pattern looks different from the sharp drops we saw earlier. The chart's showing oversold signals near current levels, marked by blue candles, and there's early bullish divergence forming – basically, momentum indicators are starting to improve even as price holds steady.
⬤ There's also a dotted trailing indicator on the chart that's been pointing down but is now getting closer to the actual price. If Oracle can push above both this indicator and break through that descending trendline with a solid close, it would mark a real technical shift. But that hasn't happened yet. Right now, we're looking at a potential relief rally setup, not a confirmed trend reversal – the stock's still working within a broader correction pattern.
⬤ Why does this matter? After extended selloffs, stocks often stabilize or see countertrend bounces once sellers step back. A short-term relief rally in Oracle could shift sentiment across other beaten-down large-cap tech names. That said, ORCL is sitting at a crucial spot where the next move will tell us whether this is the start of something bigger or just a breather before more downside.
 Usman Salis


