 Eseandre Mordi

⬤ Oracle shares have fallen hard sliding from about $346 to the low $200s. The drop proves that no stock escapes a correction, even when AI fever runs hot. On the weekly chart the price now sits at $220.66, up 5.80 percent in the latest session hinting that the weeks long sell-off has paused.
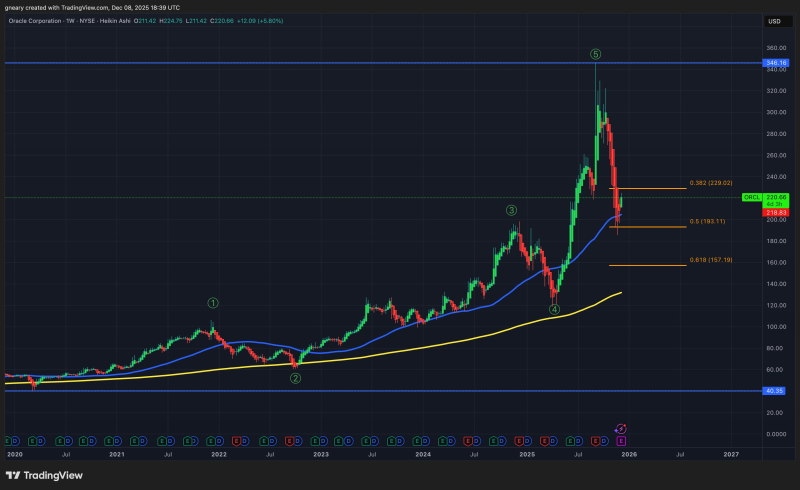
⬤ The same chart carries an Elliott-wave label - the peak at $346 ended the up-move and a deep pullback followed. Fibonacci retracements sit at $229.02 (38.2 %), $193.11 (50 %) and $157.19 (61.8 %). The last low landed just above $193 before the rebound to $220 - the price shuttles between those two upper bands. Long-term moving averages lie well under the quote, evidence that the multi year advance remains intact.
After a gain above 100 %, people simply take profits.
⬤ The chart echoes the remark. Oracle's climb that began in early 2023 and stretched into mid-2025 turned into urgent selling once traders chose to cash out near the top. Though the wider AI sector stayed firm, ORCL shed value from $346 to roughly $185 - $200 between September besides November, a reminder that a leading momentum name reverses fast once key support fails.
⬤ Moves of this size inside a popular theme sway market mood, mainly when a headline stock drops for months. Oracle's retreat illustrates how profit cycles and structural retracements fit inside a long growth story. With the quote now close to major Fibonacci levels, traders watch how it acts around those markers within the larger uptrend.
 Eseandre Mordi


