Peter Smith

⬤ Nvidia is trading near a crucial resistance zone around $193 after years of strong gains. The stock hasn't managed a confirmed two-week candle close above this level yet. The two-week chart shows multiple attempts to break through, but price keeps stalling just beneath this barrier.
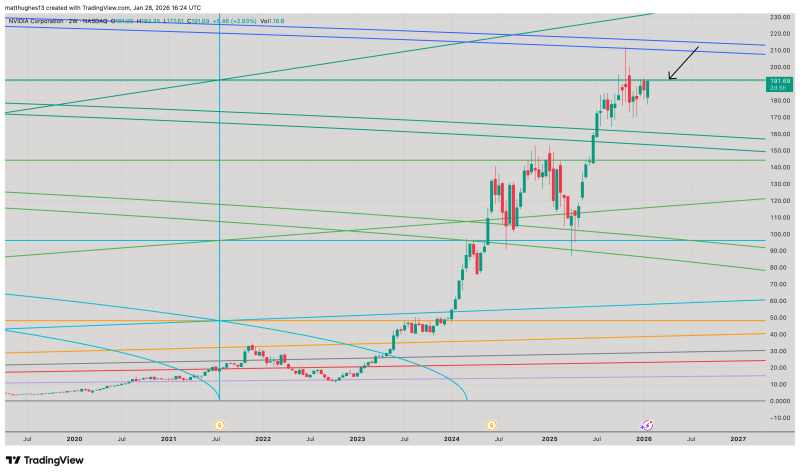
⬤ The chart reveals Nvidia hitting the upper edge of long-term trend structures that have shaped its movement since 2020. While the stock has delivered impressive gains over recent years, it's now showing hesitation around $193. Every time price touches this zone, it consolidates instead of pushing higher—making this a critical level that needs a proper breakout on longer timeframes.
⬤ Even without breaking resistance, Nvidia stays well within its bullish structure. Price holds comfortably above previous support areas and rising trend lines, showing buyers aren't backing down. But that $193 level matters—especially since Nvidia often leads the semiconductor and tech sectors. A real breakout could spark fresh momentum across growth stocks, while another rejection might trigger consolidation as traders digest recent gains.
 Peter Smith