Usman Salis

⬤ Nvidia continues trading within a well-defined symmetrical triangle, where price compresses between higher lows and lower highs. Last week printed a shooting star near descending resistance, signaling rejection at the upper boundary and pushing the stock back toward the mid-range of the formation. The weekly close near the 21 EMA highlights equilibrium between buyers and sellers.
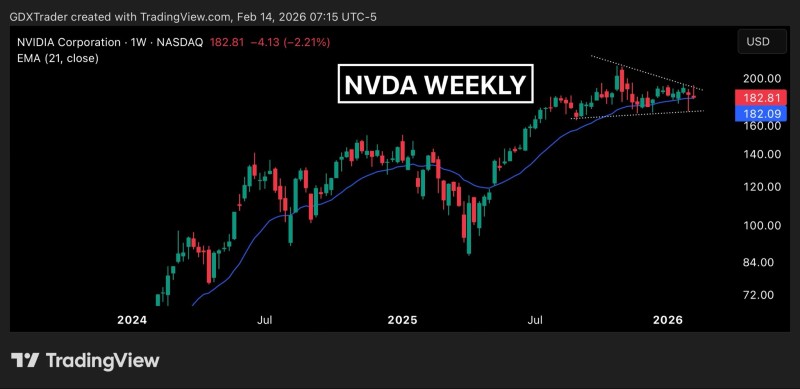
⬤ The NVDA structure reflects contracting volatility rather than directional momentum. While the broader uptrend remains intact due to the sequence of higher lows, repeated failures at resistance show sellers still defend the upper boundary. This creates a neutral environment where price oscillates inside the range. A similar stabilization phase was described in NVDA holds 170 support.
⬤ From a psychological perspective, the pattern represents a volatility squeeze where energy builds before expansion. "Attempts to break higher continue to fade, while pullbacks stabilize near moving-average support," highlighting the current indecision. Until price decisively closes above resistance, the chart doesn't provide a confirmed long signal. Comparable uncertainty appeared in NVDA tests critical support at 130.
⬤ Compression phases typically precede larger moves, but direction can't be assumed while price remains inside the triangle. A confirmed breakout would signal trend continuation, while rejection would extend sideways action. For now, NVDA remains range-bound within an overall bullish structure awaiting confirmation.
 Usman Salis