 Eseandre Mordi

⬤ Nvidia has shifted into consolidation mode after a powerful multi-month rally, with recent chart data revealing significant valuation compression. The daily NVDA chart shows price pulling back from highs above $200 and now trading near the $170 level. Nvidia's trailing earnings multiple has declined to a six-month low, marking a notable shift in market sentiment toward the stock.
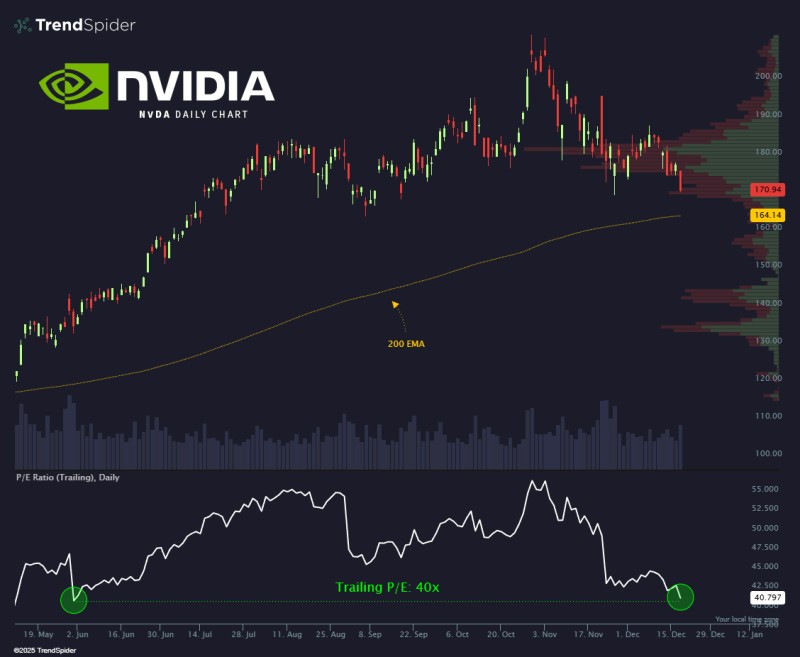
⬤ The chart reveals NVDA transitioning from an aggressive uptrend into a corrective pattern. After peaking in late autumn, shares moved lower with increased volatility and a series of lower highs. Current trading sits just above a key volume profile zone near $164 - a high-activity area that often acts as support. The rising 200-day exponential moving average reinforces this region as crucial technical support.
⬤ Nvidia's trailing price-to-earnings ratio has contracted sharply to approximately 40x, its lowest level in six months. This compression shows how recent price weakness has outpaced the valuation expansion seen earlier in the year. Current valuation levels now sit closer to those observed before NVDA's most recent acceleration, suggesting a meaningful reset in how traders are pricing the stock.
⬤ This matters because Nvidia remains central to both the semiconductor and AI sectors. NVDA's valuation movements often drive sentiment across related tech stocks and major indexes. With price consolidating near long-term support and valuation multiples resetting from elevated territory, how NVDA reacts around these zones will likely shape expectations for sector leadership and overall market risk appetite in the coming weeks.
 Eseandre Mordi


