Peter Smith
The market's AI darling may be flashing a warning sign. Nvidia (NASDAQ: NVDA), which has led the AI-fueled rally, recently dropped below its 50-day moving average—a key technical indicator that traders watch closely for momentum shifts.
Price Action Shows Loss of Support
Trader jbulltard noted that "the entire economy is losing the 50-day," hinting that Nvidia's pullback might signal exhaustion across the broader U.S. stock market. Nvidia's daily chart reveals a clear shift in momentum. After peaking at $195.62, the stock has retreated to the $178–$180 range, breaking below the 50-day moving average marked in yellow. The consistent red candles indicate sustained selling pressure, and this is the first time in months that NVDA has lost this critical trend line. Volume data confirms the breakdown is real, not just a fleeting dip, suggesting that buying interest has cooled after an extended run-up.
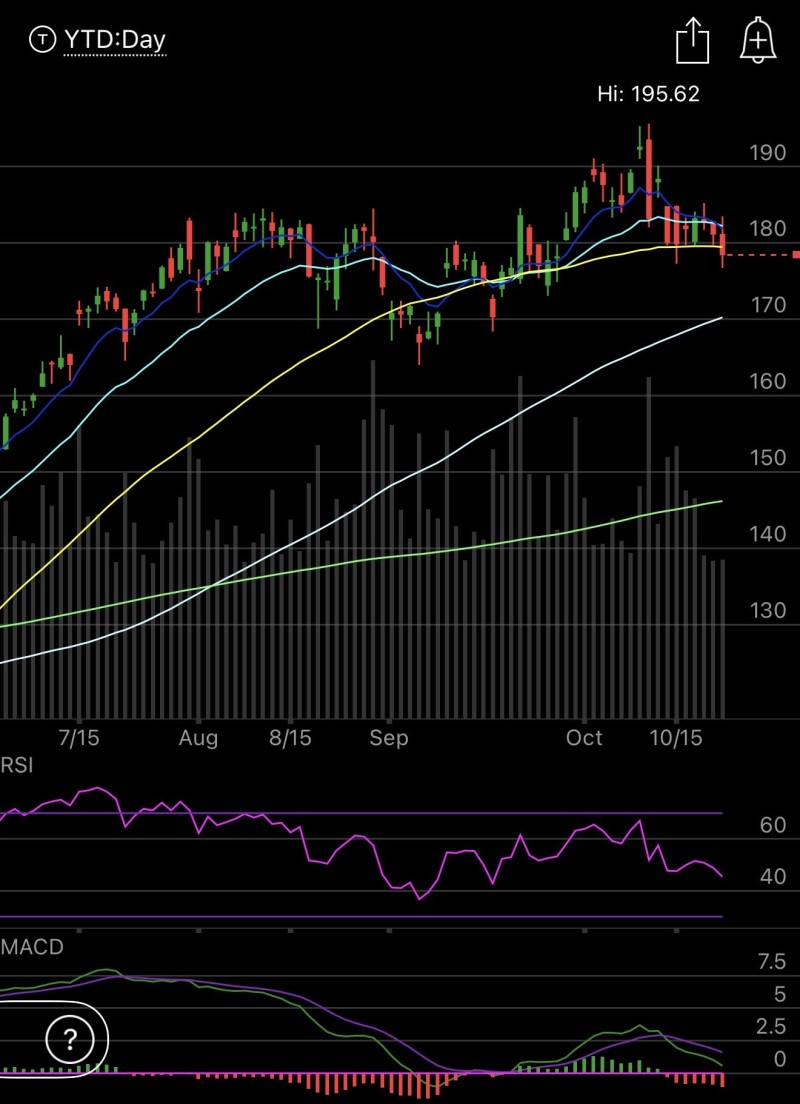
The RSI has slipped below 50, showing a shift from bullish to neutral territory and edging toward oversold levels. Meanwhile, the MACD crossed below its signal line, with the histogram turning negative—a classic bearish setup. These indicators suggest Nvidia may need time to establish support before any meaningful recovery begins. The combination of weakening momentum and negative divergence points to a short-term correction phase.
What's Driving the Pullback
Nvidia's breakdown mirrors recent pressure across major indices like the Nasdaq 100 and S&P 500, which have also tested their moving averages. Rising Treasury yields continue weighing on high-valuation growth stocks. After hitting record highs, investors are locking in profits from AI stocks as valuations stretch thin. Nvidia's upcoming earnings report adds uncertainty, with expectations of slower growth compared to previous quarters. At the same time, money is rotating out of high-growth tech into defensive plays like utilities and energy, suggesting a broader cooling in risk appetite rather than an isolated issue.
Support and resistance zones:
- Resistance at $185 (the 50-day average, now acting as overhead resistance)
- Immediate support around $170
- Major support near $160 (close to the 100-day moving average)
If Nvidia can't reclaim $185, further downside toward $170–$160 looks likely. However, a quick bounce back above the 50-day average would restore confidence and suggest the pullback was just a temporary correction rather than a trend change.
Nvidia's technical breakdown below the 50-day moving average reflects not just weakness in a single stock but potentially broader market fatigue. While the long-term AI story remains compelling, the near-term picture has turned cautious. Whether this develops into a deeper correction or just a healthy pause depends largely on whether support at $170 holds and how investors react to upcoming earnings. For now, traders are watching closely to see if this is a buying opportunity or the start of something more concerning.
 Peter Smith