 Usman Salis

After months of sideways action, NVDA is showing signs of a potential resolution. The Analyst pointed out that the stock has been flat for over half a year, even as broader attention around its valuation and positioning keeps building. That tension between price stagnation and underlying narrative is now spelled out clearly in the chart.
The $153-$184 Range That Defines the NVDA Battle
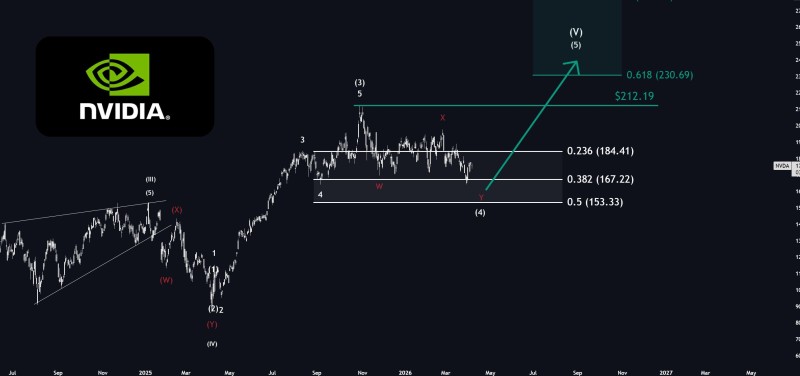
The chart shows NVDA trading within a tight horizontal structure, bounded roughly by the 0.5 Fibonacci level near $153 and resistance around $184. Price has repeatedly reacted to these zones without picking a direction.
The stock has been flat for over half a year, even as the narrative around its valuation continues to build - that tension is now clearly reflected in the chart.
Here is how the current range breaks down:
- The lower boundary near $153 continues to act as key NVDA support
- The $184 region caps every upside attempt
- Price remains trapped between these levels without a confirmed breakout
This lines up with broader observations that NVDA entered a consolidation phase after its prior rally, with similar range-bound behavior noted across recent analyses.
NVDA Structure Points to a Setup, Not a Breakdown
The internal structure visible on the chart points to a corrective phase rather than a confirmed trend reversal. Price is holding within a retracement zone between 0.382 (~$167) and 0.5 (~$153), which typically serves as a stabilization area during corrections.
There are no clear signs of a breakdown below structure - the range is tightening and volatility is compressing while price continues to respect key retracement levels.
There are no clear signs of a breakdown below structure. Instead:
- The range is tightening
- Volatility is compressing
- Price is respecting key NVDA retracement levels
This type of behavior often precedes expansion. Similar setups - compressed ranges and tightening bands - have historically led to sharp directional moves in NVDA.
Why the Next NVDA Move Matters More Than the Last
The current phase is less about direction and more about timing. Extended consolidation periods like this tend to build pressure, and once that pressure releases, the move can be decisive. From a structural standpoint, two scenarios remain valid:
- A breakout above $184 opens the path toward higher retracement targets near $212 and beyond
- A final sweep lower toward the $153 zone before reversal cannot be ruled out
This uncertainty is consistent with broader technical projections, where NVDA remains in consolidation but still holds a constructive long-term structure. Whether the stock resolves higher immediately or after one more downside sweep, the NVDA chart targets $230 as the next major level to watch.
Extended consolidation periods build pressure - and once released, the move tends to be decisive. The current range is unlikely to persist much longer.
Final Phase Before NVDA Resolution
NVDA's chart reflects a market waiting for confirmation. The stock is neither trending higher nor breaking down - it is compressing. That compression, combined with clearly defined boundaries at $153 and $184, suggests the next move will likely set the tone for the coming months. The structure indicates the current range is unlikely to hold for much longer.
 Usman Salis


