 Marina Lyubimova
⬤ Nvidia holds steady while traders ask where it heads next. The stock still has space to rise toward the $220 record high, supported by clear short term bullish signals. The chart shows an Elliott Wave structure that has unfolded well - price sits inside an upward sequence that appears to have further room to run.
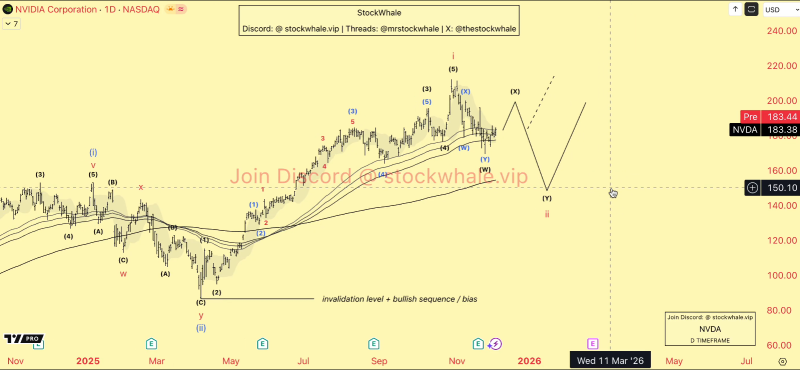
⬤ The complication is that a head-and-shoulders pattern is starting to form and that draws the bears. If the pattern completes selling pressure should appear near the $190 area. The chart displays both finished wave sequences and possible next steps including a case where price drops into a corrective phase before a larger rally resumes.
⬤ The action across the next few sessions carries high weight. If buyers hold the line plus stop the bearish pattern from confirming, the probability of touching $220 in 2026 rises. If support breaks, momentum would flip and price would head toward the lower wave targets instead.
⬤ The outcome carries weight for the broad market because Nvidia sets the tone for semiconductor besides AI shares. A clean advance to $220 would lift tech sentiment across the board, while a breakdown would pull the sector lower and leave investors more cautious. Both paths remain open - NVDA demands close attention right now.
 Marina Lyubimova


