 Marina Lyubimova

NIO (NYSE: NIO) is taking a breather after its recent rally, and right now all eyes are on a few crucial support levels that could decide where the stock heads next. The electric vehicle maker is sitting at an interesting technical crossroads, and understanding these levels could be the difference between catching the next wave up or getting caught in a pullback.
What's Happening Now
A recent chart analysis from JLW highlights something important: NIO's daily chart is testing two support levels at the same time—the uptrend line near $6.50 and the 50-day moving average at $6.46. When price tests multiple supports together like this, it usually creates a pretty solid floor. Bulls tend to defend these zones aggressively because losing them can trigger more selling. If these levels give way, the next stop could be around $6.30, where there's a gap from earlier price action. That said, the bigger picture still looks decent. There's no real danger unless we start talking about the 200-day moving average down at $5.20, and honestly, that seems pretty far-fetched right now.
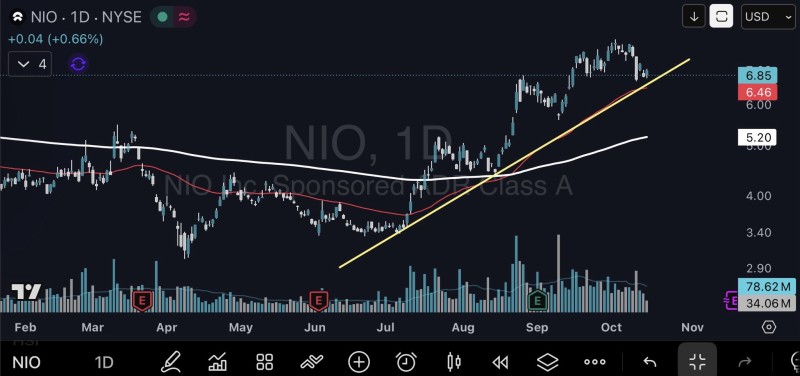
Price Levels That Matter
The trendline at $6.50 has been guiding NIO's climb, so holding above it keeps the uptrend alive. The 50-day MA at $6.46 backs that up and shows the short-term momentum is still positive. If both fail, $6.30 becomes the target—that's where a previous gap sits. Way down at $5.20 is the 200-day MA, which acts as a long-term safety net, but we're nowhere near testing that yet.
NIO's been bouncing back nicely from its summer lows, helped by stronger trading volume and better vibes around EV stocks in general. Sure, there's some choppiness in the short term, but as long as the stock stays above that $6.46–$6.50 zone, the structure holds up fine.
 Marina Lyubimova


