 Saad Ullah

NIO has been catching traders' attention with its recent surge, but the real test is just beginning. The Chinese EV maker faces a crucial resistance zone that could make or break its current rally. Here's what the charts are telling us about what comes next.
Strong Rally Meets Reality Check
NIO jumped to $7.45 with gains over 6%, showing impressive strength despite facing significant headwinds. According to trader Pax, more than 6 million shares were shorted yesterday, yet the stock kept climbing.
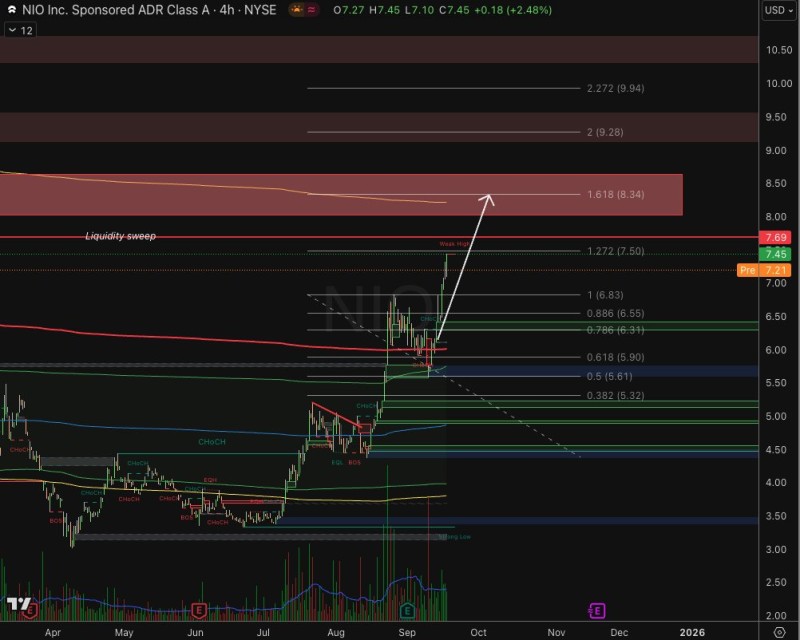
While breaking through $7.7 looks doable, the real challenge lies in conquering the heavy resistance zone between $8.3 and $8.5.
This area lines up with a Fibonacci 1.618 extension at $8.34, where many previous buyers got trapped and will likely want to exit once they hit breakeven.
What the Charts Show
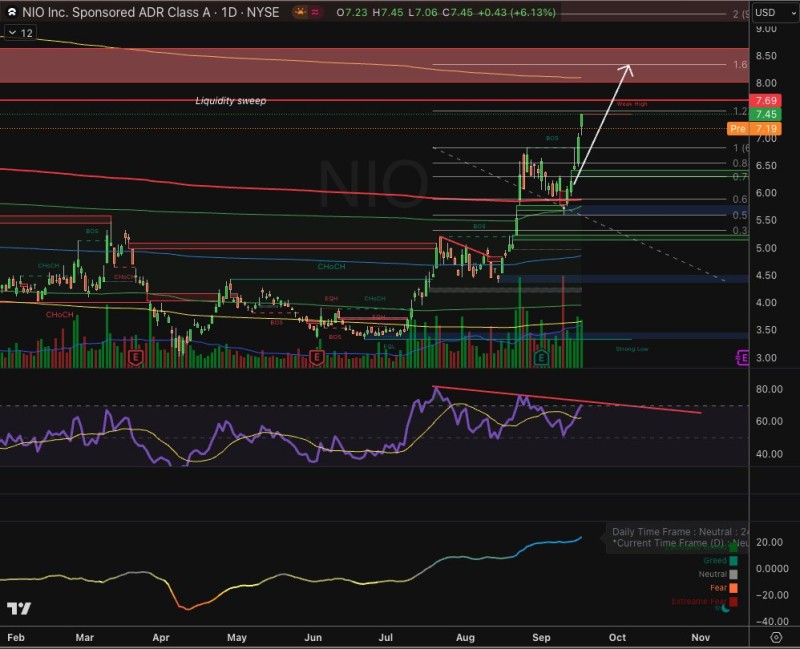
The technical picture reveals both opportunity and caution. Immediate resistance sits at $7.69-$7.70, but the major battle will be at $8.34 where significant liquidity awaits. On the downside, strong support clusters around $6.30-$6.50, with deeper backing at $5.90. Volume patterns show heavy buying interest, though much of this appears driven by short covering rather than fresh demand. The daily RSI displays bearish divergence while the weekly RSI sits in overbought territory, suggesting limited room for further gains. The anchored VWAP also aligns near $8.3, reinforcing this level as the key barrier traders need to watch.
Different Times, Different Context
While NIO's current move might remind some of its explosive 2021 breakout, the environment has changed dramatically. Higher interest rates, tighter credit conditions, and softer EV demand in China create a more challenging backdrop. The long-term outlook may remain positive with potential targets above $50, but the path forward won't be smooth. Expect pullbacks and shakeouts along the way as the market digests each move higher.
 Saad Ullah


