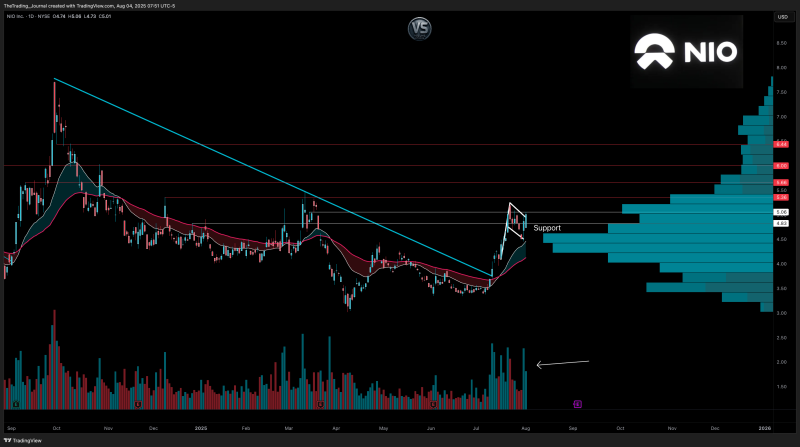
NIO Inc. (NIO) stock has been through hell and back over the past year, getting crushed by everything from EV market concerns to China regulatory fears. But something interesting just happened on the charts that has technical traders paying attention. After months of relentless selling pressure, NIO finally broke out of its long-term descending trendline and is now forming what looks like a textbook bull flag pattern. With the stock holding key support levels and volume backing the move, this could be the reversal exhausted NIO bulls have been waiting for.
NIO Finally Breaks Free From Months of Pain
After getting beaten down for what felt like forever, NIO stock (NIO) just did something pretty interesting – it broke out of that nasty descending trendline that's been crushing bulls for months. We're looking at a classic bull flag pattern here, and honestly, it's got some decent legs under it.
The stock's sitting at $5.01 right now after hitting $5.06 earlier, but here's the key thing – it's holding above that crucial $4.83 support level. That's not just some random number either; it lines up perfectly with a high-volume zone, which basically means there's real buying interest down there.

Volume Surge Says This Breakout Might Be Legit
Here's what's got traders excited: the volume spike when NIO busted through that resistance line wasn't just noise. When you see real volume backing a breakout like this, it usually means institutions and smart money are getting involved, not just retail traders throwing darts.
Looking ahead, NIO's got some resistance levels to deal with at $5.36, $5.50, and $5.66. The big psychological level everyone's watching is $6.00, with another major zone around $6.44. If this bull flag plays out, those are your targets.
The Setup Looks Solid (For Now)
Right now, NIO's consolidating in this tight flag pattern between $4.83 and $5.06. As long as it stays above that $4.83 support, this bullish setup stays alive. A clean breakout above the flag – especially with more volume – could send it running toward those higher resistance zones.
Of course, if $4.83 breaks, this whole party's over and we're probably heading back below $4.70. But for now, the technical picture looks pretty decent for the bulls.
 Peter Smith

 Peter Smith


